Introduction to Multi-Timeframe Trading Strategies
The golden rule of trading is to always trade with the trend because this will tilt the odds in your favor and give you a greater chance of success in the long run.
The problem is that a currency pair could be trending upwards on one timeframe and trending downwards on another.
The solution to this is to look at multiple time frames, and more specifically, you want to find a pair that is trending upwards on two or three longer term timeframes to confirm that the underlying trend is bullish, and then wait for a good opportunity to go long on a shorter term timeframe.
For instance, if a pair is trading upwards on the monthly, weekly and daily timeframe, you would be looking to enter on the 4-hour timeframe.
Shorter term traders could also wait for a pair to trade in the same direction on the daily, 4-hour and 1-hour chart, and enter trades in the same direction on the 15-minute chart.
To give you an idea of how you could execute this type of trading strategy, here is an example from the USD/JPY pair that occurred earlier today.
Identifying the Underlying Trend
For this example I will be using my preferred EMAs (exponential moving averages), the 10, 20, 50 and 200-period EMAs, to indicate the trend.
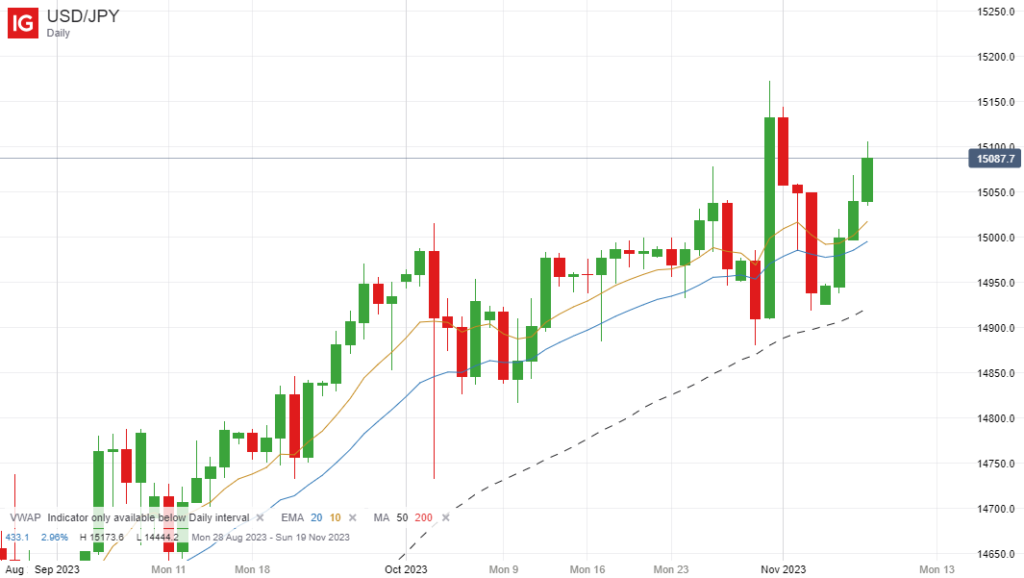
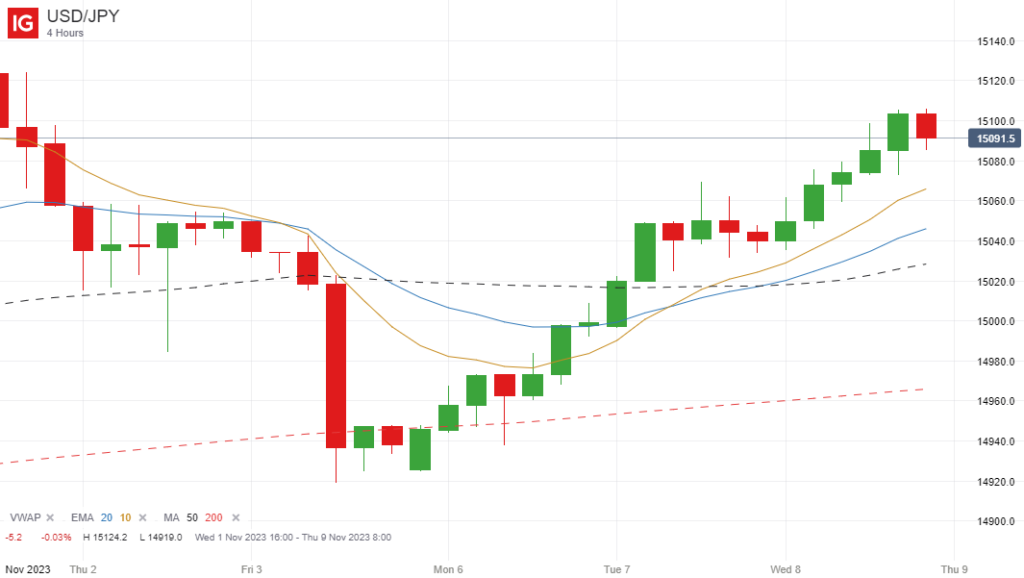
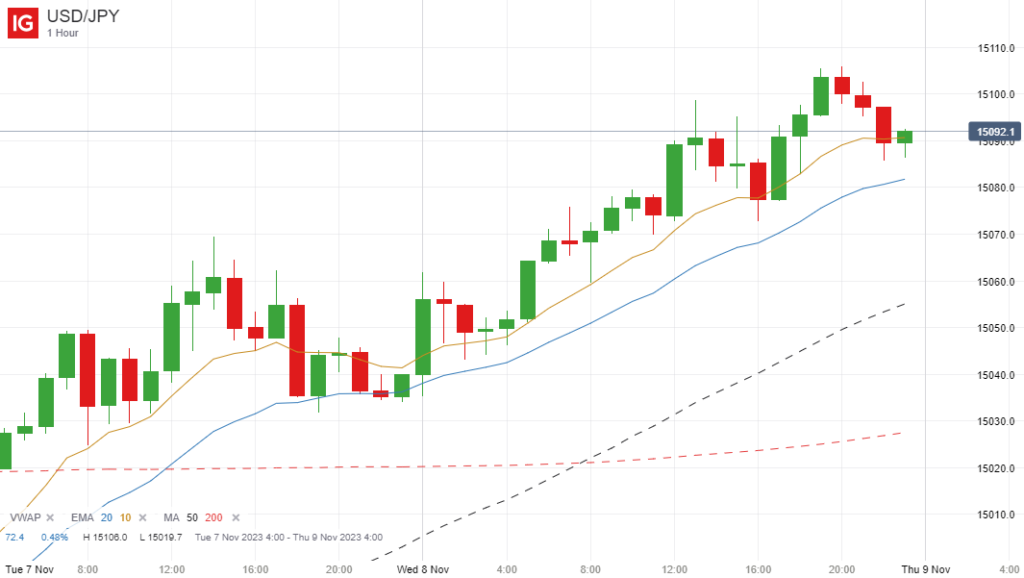
More specifically, I want to find pairs where the price is trading above (or below for shorting opportunities) all four of these moving averages on at least two, but ideally three longer term timeframes, and that’s what we saw here.
Here are the daily, 4-hour and 1-hour charts of the USD/JPY pair to highlight this:


You can see that the price was above all four moving averages heading into the London market open at 8 AM.
Trade Execution
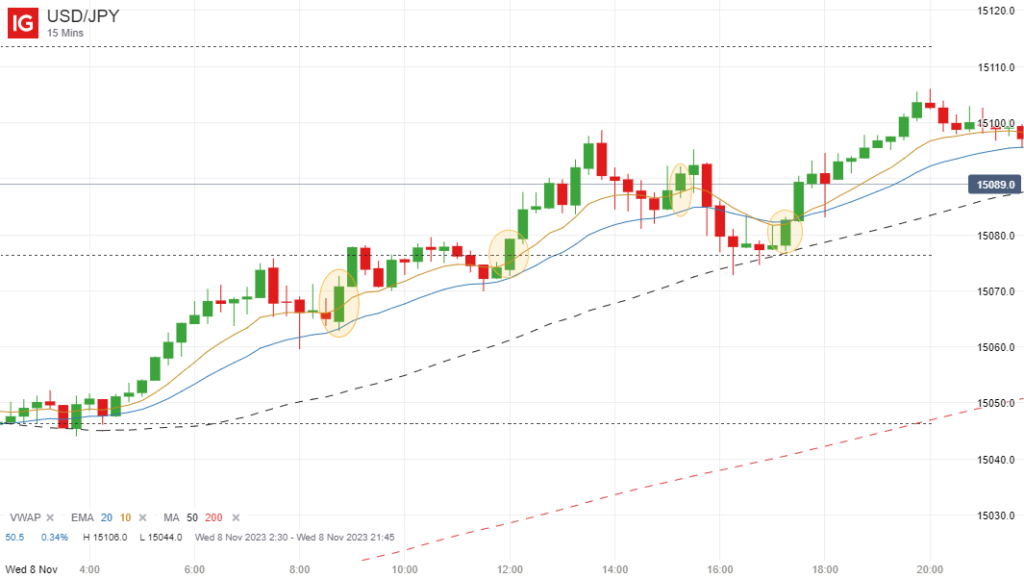
Once we established that this pair was in a very strong upward trend, the next step was to drop down to the next logical time frame, which in this example would be the 15-minute chart if we are continuing down from the 4-hour and 1-hour charts.
The key here is to wait for some temporary weakness on this timeframe followed by a continuation move in the same direction as the prevailing trend on the higher timeframes, ie upwards.
There are a few different ways you could trade this strategy. You could wait for a bounce off the 10 or 20-period EMA, or indeed the 50-period EMA, or you could wait for a bounce off the VWAP indicator.
You could also use a 5-period EMA instead of a 10-period EMA, and wait for the 5-period EMA to cross the 20-period EMA in the direction of the trend, which is another popular strategy.
It’s important to note that whichever strategy you use, you need to see the price move strongly higher after a period of weakness (preferably back above the EMA(5) or EMA(10)), and you should avoid entering early in anticipation of a possible bounce.
So with that in mind, I have circled four possible entry points on the 15-minute chart below where you could have entered a long position:

Final Thoughts
As you can see, 3 out of 4 of these trades would have been profitable and even the losing entry would have eventually moved into profit (if your stop loss wasn’t triggered first) thanks to the strength of the underlying long-term trend.
That’s the message I want to get across. Your entry points don’t always have to be perfect. If you always trade with the underlying trend, your overall win rate will be much higher, and by using a multi-timeframe strategy such as this one, it is not hard to find some high probability set-ups.

You are trading (god) can you possibly give more examples please?
I am definitely not a trading god 🙂
I have, however, just uploaded another trade example on gold that you may be interested in reading.
Thank you for making trading look easier and simpler. I would appreciate it if you could post more examples. Thanks