Price Action
The US dollar has been very strong in recent weeks, as you can see for yourself if you look at the charts of the various dollar pairs.
However in this article I want to take a closer look at the USD/JPY pair in particular because although this pair is also trading higher, and is now close to the 110 level, it could also be gearing itself for a breakout.
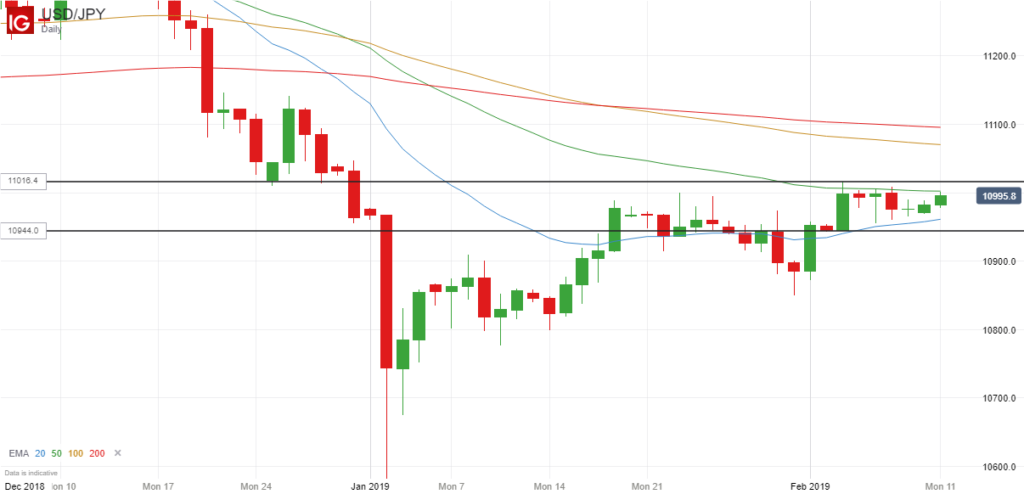
It is not yet clear which direction this breakout will be, but we have had a lot of sideways price action in recent days, and the exponential moving averages are starting to converge on the daily chart and are all trading very close to each other (which often happens before a significant breakout):

Inside Bar Formation
Most importantly of all, you can see from the chart above that we now have an inside bar formation where the last 5 candles (6 if you include the Sunday candle) are all trading within the range of the large candle from last Monday (indicated by the two black lines).
This is one of the main things I like to look for when trying to identify possible breakouts because the longer the price trades within the range of a previous candle, the more likely it is for the price to break strongly upwards or downwards when it eventually closes outside of this range.
Trading Opportunity
Subsequently, it might be worth watching the price of the USD/JPY over the coming days to see if it can break decisively out of this range. The high from the initial set-up candle is 110.16 and the low is 109.44, so these are the key levels to look out for.
Some people like to jump into a trade as soon as the price moves above or below the high or the low, but I personally think it is better to wait for the daily candle to close to see if it actually closes outside of the range. Then it is far more likely to be a confirmed breakout in my experience.
If it breaks higher, then the 200-day moving average is an obvious price target, which currently stands at 111, but I wouldn’t be at all surprised to see the price continue to break above this moving average to around 112.
If, on the other hand, it breaks lower, then I would expect it to test its recent low from last month, which is about 108.5, and possibly go as low as 108, but we will just have to wait and see what happens.
Please bear in mind that these are just my own thoughts and opinions, and it doesn’t represent professional financial or trading advice in any way.

Leave a Reply