Price Action
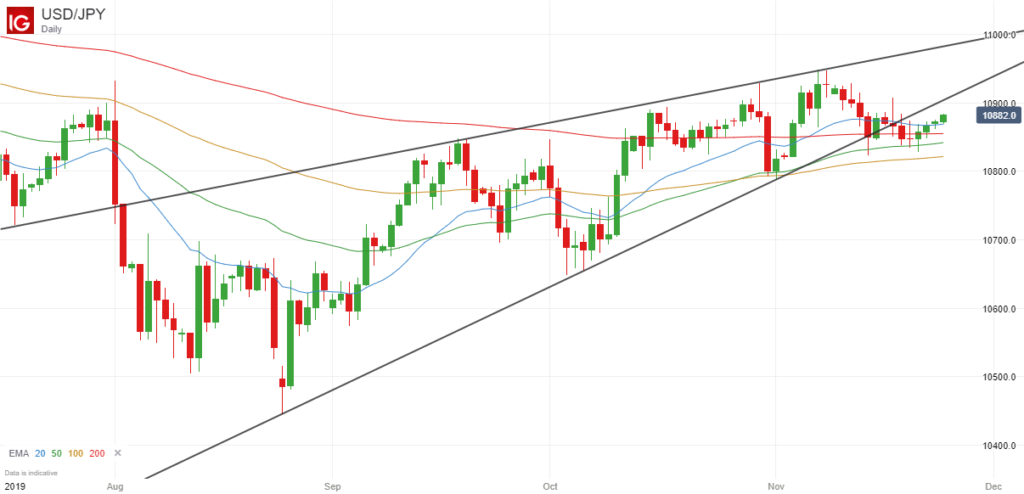
It has been interesting to watch the price action of the USD/JPY pair in recent months because after hitting a low of around 104.46 back in August, it has been slowly trending upwards since then, and currently trades at 108.80 at the time of writing.
Indeed as you can see from the price chart below, the price has bounced back so much, it has not only touched the 200-day exponential moving average (as indicated by the red line), but has also traded above it for quite a while.

Downward Price Breakout
You can also see from the chart above that it was clearly trending within two trendlines that marked the high and low points of this rising trend, but significantly closed below the lower trendline last week.
To be honest, I was expecting that this would probably mark the end of the recent uptrend, and would be the catalyst for a new downward move for the USD/JPY, but so far there hasn’t been a wave of selling to drive the price lower.
This is probably because some analysts, including Goldman Sachs, have been talking down the prospects of a recession in the US and global economy in 2020, predicting growth rates of 2.3% and 3.4% respectively for the coming year.
Nevertheless, there is still a possibility of a strong bearish candle forming on the daily chart in the next few days, so it could still be worth watching.
Future Price Moves
If the price does trade strongly lower, and closes below its two recent lows of 108.24 and 108.28, then I would be fairly confident that this would signal the start of a new downward price breakout.
As a result of this, the price would close below all of its major moving averages (20, 50, 100 and 200-day EMAs) and there is a lot of downside potential because it could easily drop back into the 104 – 106 range.
The alternative scenario is that the recent short-term strength in the USD/JPY continues, and we continue to see the price trading upwards of 109.
If this were to happen, then we would see the 50 and 100-day EMAs cross over the EMA (200), which is a very bullish signal that could attract a wave of buying to push the price above its previous highs of 109.50 and beyond the 110 level.
So the point is that while the picture is still unclear, the price action of the USD/JPY over the coming days and weeks could give you a strong indication as to whether there is going to be a sustained upwards or downwards trend in the near future.
I would probably favour a downward breakout at this moment in time simply because the MACD and stochastic indicators are suggesting that this long-term upward trend is running out of momentum on the weekly chart, but as I say, there is no need to second-guess the direction of any breakout until we get some clearer signals on the daily chart.

Leave a Reply