Triangle Chart Patterns
It can be very useful to draw trendlines connecting the highs and the lows to see the underlying trend, and to spot any potential breakout opportunities that may be available.
Sometimes you will get ascending triangles and sometimes you will get descending triangles, but where there has been a sideways trading range, you will often see symmetrical triangles where the price is trading in an ever decreasing trading range / triangle.
This is beneficial for traders because the price has to eventually break upwards or downwards out of this triangle at some point, and when it does it often results in a strong breakout.
Symmetrical Triangle on USD/CAD Pair
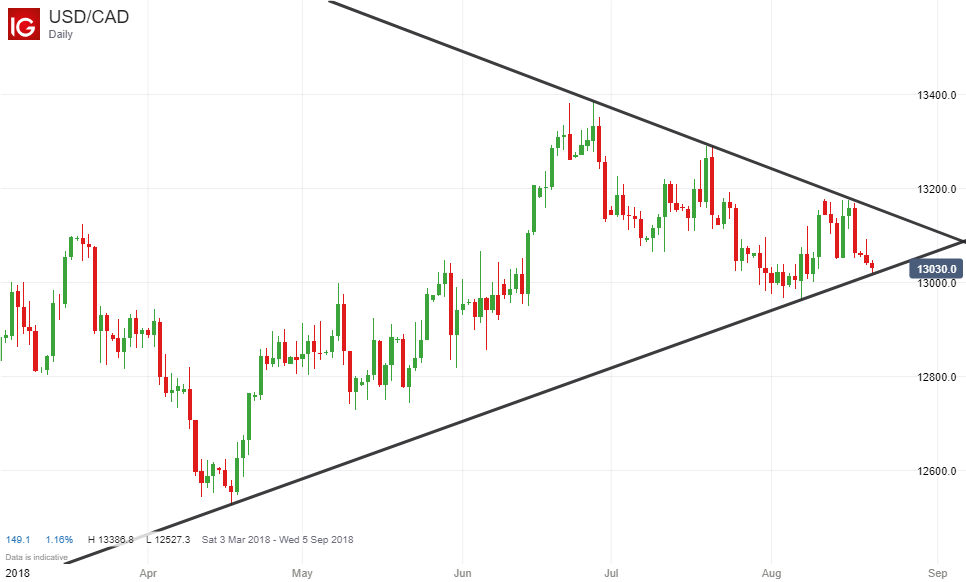
You may be interested to know that there is a classic symmetrical triangle pattern on the daily chart of the USD/CAD pair right now.

This pair has been in a slight upward trend since September 2017, but has been trading in quite a narrow sideways trading range this summer with little upward or downward momentum, which is why we now have this triangle pattern.
Potential Trade
As a result, it might be worth keeping a close eye on the daily price chart of the USD/CAD pair because it is getting very close to the lower trendline at the moment, and may be about to close below this trendline either today or in the coming days.
Therefore it could be a good time to open a new short position if the price does close strongly below this trendline because there could be a strong downward move in the following days and weeks.
As always, I am not recommending any trades. There is always the chance that any breakout could turn out to be a false one.
I am just sharing with you my thoughts and demonstrating how you can trade any breakouts that occur when the price breaks out of a symmetrical triangle pattern.

Leave a Reply