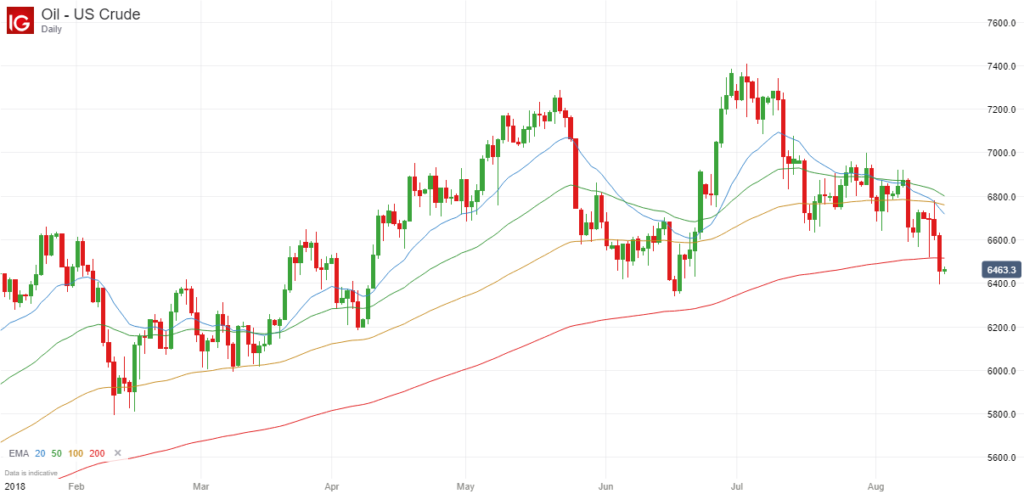
Crude Oil Price Trend in 2018
If you have been following the price of US crude oil, you will have noticed that the price has been in a slight upward trend so far in 2018, going from around $60 per barrel at the start of the year to a peak of just over $74 per barrel at the start of July.
The price of Brent Crude has also been in a similar upward trend, rising from $67 to a peak of just over $80.
As a result of this, many of the large-cap oil stocks have seen their share price rise dramatically during this time.
Downward Trend in Summer
Since the price of crude oil peaked, it has since started to trend lower because we have seen a series of lower lows and lower highs.
This is relatively normal during the hot summer months because there is not the same demand, but from a trading perspective, it is interesting to look at the price chart to see if this is a temporary drawback, or the start of a more significant downward trend.
Price is Now Below EMA (200)

One key development is that the price of US Crude has just fallen below the 200-day exponential moving average (EMA (200)) on the long-term daily chart for the first time since September 2017, as shown in the chart above.
This is significant because this is a major indicator of the long-term trend, and is an indicator that is viewed with interest and acted upon by many traders.
So if the price continues to fall and establishes itself below this EMA (200) indicator, it could well be an opportunity to go short if there is a strong downward breakout.
Key Indicators of a Change in Trend
It is far too early to say for certain that US Crude is now in a bearish trend, and therefore likely to fall a lot further, just because it has closed below the EMA (200).
What we really need to see is a downward EMA crossover, where the EMA (20), EMA (50) and ultimately the EMA (100), all cross downwards through the EMA (200) because this will give a much stronger signal that a new bearish trend is emerging, and it is time to start looking for opportunities to open short positions.
It is also worth paying attention to the price of Brent Crude as well because if you look at this price chart, you will see that the price hasn’t yet closed below the EMA (200), but is very close to doing so.
Therefore if we do see downward EMA crossovers on both of these charts, this would suggest that the price of crude oil generally is entering a period of weakness, and is highly likely to continue falling.
Closing Comments
Even if we do see downward EMA crossovers, I still think it is highly unlikely that we will retest some of the previous lows of 2016, when the price of crude oil hit really did hit rock bottom, but I think a move towards $55 and possibly even $50 is certainly possible.
Either way, it will be interesting to see how the price reacts around these key levels because the EMA (200) is such a significant indicator in the world of trading.
We may find that this indicator acts as support and the price will eventually resume its upward trend, or at least stabilize between $65 and $70, but if we see further price falls, a big downward price move is definitely possible.

Leave a Reply