Introduction
It is always interesting when prop firms put out some statistics from all of their traders’ trading activity because you can instantly get an idea of which markets are currently the most profitable, and which are potentially worth avoiding.
One of the most popular prop firms right now is The Funded Trader, and they have just released their latest stats from August, September and October 2023, and as always, they make for some interesting reading.
Most Profitable Markets

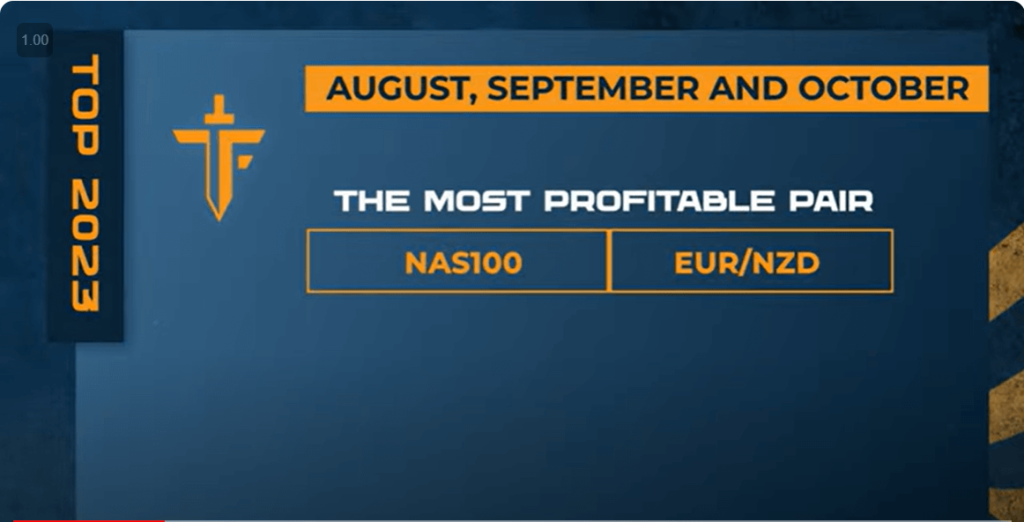
According to their comprehensive statistical analysis, the most profitable market to trade during the last three months was the Nasdaq 100.
This will come as a surprise to many because a lot of people find this to be one of the most volatile markets to trade, and one of the most challenging.
This is a market that can move fast, and can easily whipsaw in both directions in a single trading session, and it hasn’t been an easy market for longer-term traders to trade either because it basically moved sideways for two months prior to its recent rally this month.
It was also a little surprising to see that the EUR/NZD pair was one of the most profitable pairs to trade too.
This is not a pair that many traders like to trade because the spread may be a little too high at around 2-3 points with some brokers, and it is not as actively followed as the EUR/GBP or the EUR/USD pairs, for example.
However with an average daily trading range of between 107 and 145 points during these three months, it does still offer a lot of profit potential for day traders, and so it is easy to see why some traders have made some decent returns trading it recently.
Least Profitable Markets
With regards to the least profitable markets, the two most challenging markets to trade during August, Septemnber and October 2023 were the Dow Jones (US30) and gold.
It is not necessarily surprising that gold was one of them because this has always been a widow maker kind of a market to trade. Gold has the potential to blow up your account in no time at all, with big price swings that can come out of nowhere.
It is more surprising that the Dow Jones was so unprofitable for many traders because this is generally regarded as being easier to trade than the Nasdaq 100, but the stats would suggest that the opposite was true this time around. Maybe this was just a one-off occurrence.
Average Pass Rates
The average pass rates were fairly high at 27% for phase 1, and 42% for phase 2. I think this is higher than many other prop firms because the overwhelming majority fail to get past phase 1 of their respective challenges.
It is natural for the phase 2 pass rate to be higher because if a trader has the ability to pass phase 1, they should find it easier to pass the less demanding profit level of phase 2.
Average Reward to Risk Ratio
The general advice is that you should always aim for a reward to risk of over 1 so that your potential gain is always greater then your potential loss, and these latest stats would bear this out.
The average reward to risk ratio was between 1 and 1.77 for those people who passed the phase 1 and phase 2 challenges, and the average reward to risk of those who didn’t pass was around 0.5.
Drawdown
According to these stats, 71% of people failed the challenges by hitting the daily drawdown and 29% failed by hitting the maximum drawdown.
This suggests that the majority of traders are taking quite large positions in an effort to pass the challenges quickly, and are not overly worried if they end up losing the challenge by taking this bold approach.
Indeed it was revealed that out of all the traders who passed the challenges and received a payout, most of these traders will have paid for seven challenges on average prior to getting to this point.
This just shows that it can get quite expensive chasing the dream of having a fully funded prop firm account, and it is definitely not as easy as the trading furus on X make it out to be.

Leave a Reply