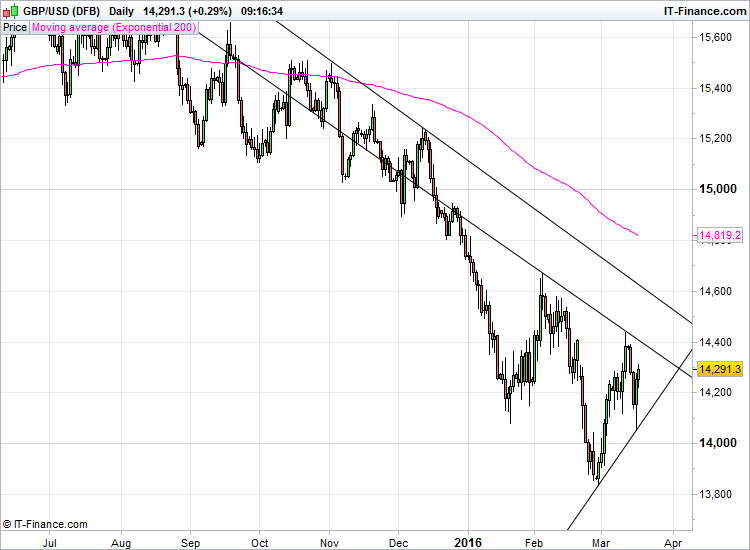
When I last wrote about this pair back in October 2015, I mentioned at the time that this was at a critical point because a decisive break downwards through the trendline could potentially lead to a sustained move to the 1.46-1.48 area.
As it turned out, the price fell a lot further than that because the growing threat of a realistic withdrawal from the EU, annoyingly referred to as ‘Brexit’ by the British media, prompted it to fall to 1.3836 at one point.
At this moment in time, the bookmakers are quoting odds of 4/11 that voters will ultimately vote to remain in the EU, and odds of 2/1 that they will vote to leave the EU.
So based on the fact that bookies are usually correct on these matters, this would suggest that an exit is still highly unlikely, and the slight recovery of the British pound reflects this fact.
So where does the GBP/USD go from here?
Well the price is obviously going to be heavily influenced by Brexit over the coming months. For example, if Barack Obama and other major political figures voice their opinion and leading business figures continue to have their say, this may influence the opinion polls, which in turn could result in some big price swings leading up to the actual vote itself.
However it’s also worth taking a quick look at the GBP/USD price chart as well because from a purely technical perspective, this pair is trading in a pennant at the moment with converging trendlines, and therefore could be set for a decent breakout when the price moves out of this narrow trading pattern:

A break upwards could see the price move towards the long-term 200-day exponential moving average at around 1.48, whilst a downwards breakout is likely to see the price test the recent lows and possibly drop a lot further.
Therefore it is worth paying attention to this pair in the coming days and weeks because there could be a decent trading opportunity at some point, particularly if the price breaks downwards because this will confirm the longer term trend.

Leave a Reply