Introduction to the EMA (200)
The 200-day exponential moving average, or EMA (200) for short, actually has a lot of importance in the world of trading.
When the price breaks upwards through the EMA, it is often a sign of strength, but more significantly, when the EMA (50) crosses upwards through the EMA (200), it is a much stronger signal to go long.
Similarly, when the EMA (50) crosses below the EMA (200), it is referred to as a death cross, and gives a strong signal to go short.
However it is important to note that the EMA (200) is often a key support or resistance level, whereby the price will touch this line, before reversing in the opposite direction.
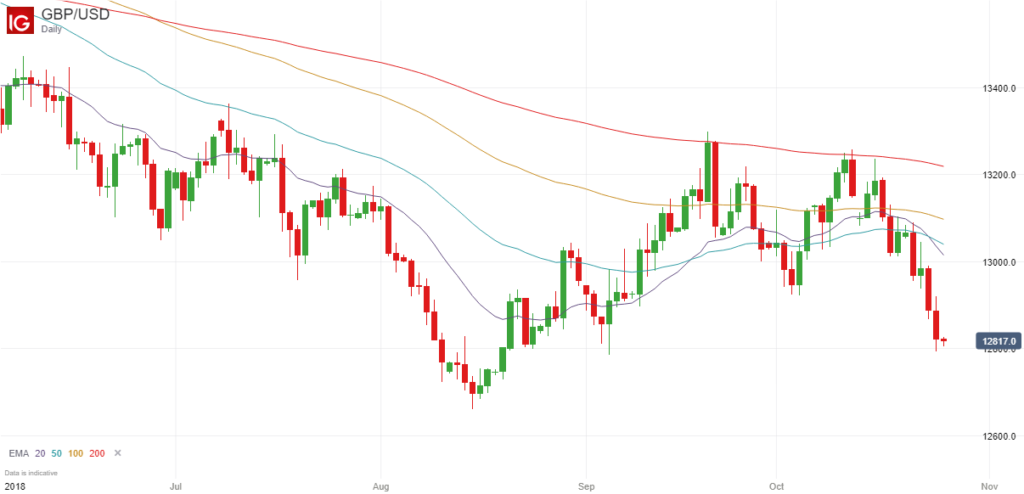
Many people are sceptical about the importance of such indicators, but you only need to look at the daily chart of the GBP/USD pair to see how the price reacted when it touched the 200-day moving average:

GBP/USD Sell-Off
The red line indicates the EMA (200) in the chart above, and you can see that the price touched this key indicator on four separate days, and came close to it on one other day as well, but on every occasion the pair was met with a wave of selling that drove the price back below this indicator.
Similarly, this indicator will have acted as a target price to take profits for any people who were long on this pair, so this too would have helped force the price down.
Final Thoughts
The point I want to make is that this 200-day exponential moving average is always worth including on your daily price charts because it is a good place to take profits, and is a good level to watch because it often acts as a key support or resistance level.
Similarly if the price goes straight through it and the EMA (50) later crosses through it as well, it is often seen as a very strong signal that a new trend has emerged. Therefore you should consider looking for opportunities to get in on this trend at a good price when this occurs.