December Price Falls
December is usually quite a good month for stock market traders and investors, but this has apparently been the 2nd worst December on record.
The leading stock market indices have all fallen sharply and there are many reasons why. Brexit, interest rate rises, trade tariffs and the threat of a possible recession have all weighed heavily on the indexes this month.
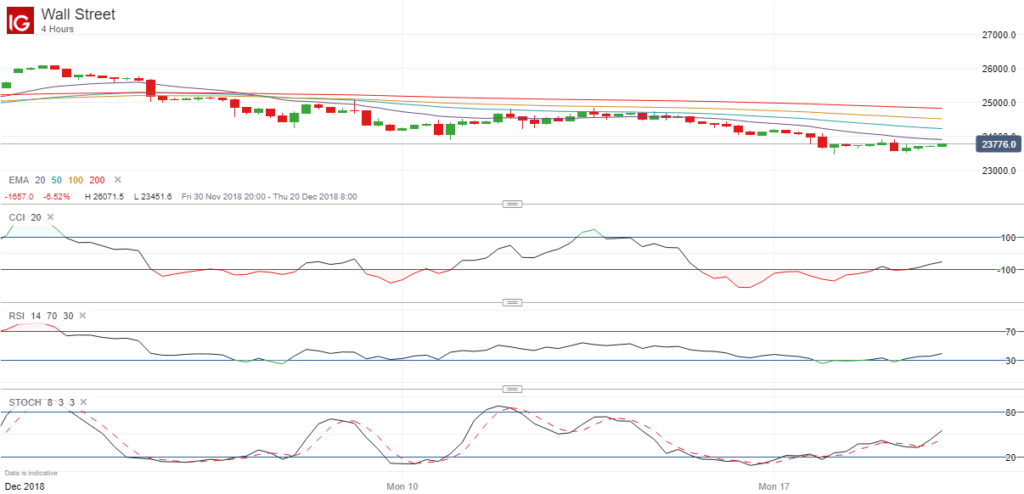
As a result of this, many people have given up on the idea that there will be a Santa rally this year, but looking at the 4-hour chart of the Dow Jones, there is still hope:

Positive Divergence
As you can see, the price has recently been posting new lows, but if you look at three of the leading technical indicators, you will notice that there has been positive divergence on each of these indicators.
In other words, as the price has posted new lows, the CCI, RSI and Stochastics indicators have all failed to post new lows, and have actually been trading higher, which suggests that the downward move is running out of momentum.
Future Price Move
This positive divergence suggests that the price is likely to move higher in the coming days, but it should always be emphasized that these are all just indicators. The price could easily turn lower and start a new downward wave.
However with just 4 trading sessions left before Christmas, my own view is that we will still see a Santa rally this year, which could then continue until the New Year, as it so often does.
Therefore a price of 24,000 would be my first target, which should easily be achieved if there is such a rally, and looking further ahead, I wouldn’t be surprised it the price went back to the EMA (100) on this time frame, which is currently around 24,500. This would result in a rise of around 3% from the current price level.
As always, these are just my own thoughts and predictions. This in no way represents professional trading or financial advice. You should always do your own research before entering any positions in the markets.