Introduction
I have recently been discussing why the EUR/GBP is no longer an easy pair to trade, particularly from a day trading point of view.
I also highlighted the fact that this pair has been trading in quite a sideways trading range for a long period of time now, making it fairly difficult for long-term traders to trade as well.
All of the points raised in this article still hold true today, but that doesn’t mean that you still can’t make money trading this pair. There is still the potential to trade any breakouts when they occur, and to take advantage of any new trends that are emerging on the price chart of this pair.
Rising Channel
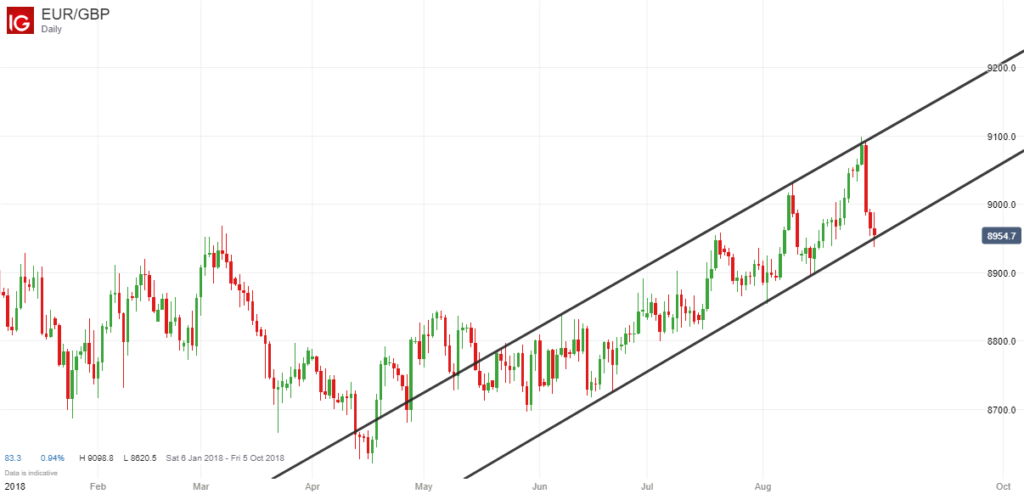
The EUR/GBP has indeed been trading in a sideways range if you look at the long-term price chart, but in recent months it has started to trend upwards and post new highs for 2018.
You will also notice that it has been trading within a rising channel if you draw some trendlines on the daily chart, and is now interesting to watch because the price is at a critical point at the moment.

After posting a yearly high of around 0.9099, the price of the EUR/GBP pair has dropped back nearly 150 points to just over 0.8950, thanks largely to positive news regarding Brexit boosting the British Pound, and is trading right at the bottom of this rising channel, even dipping below it at one point during yesterday’s trading session.
Trading Opportunities
I have to admit that the EUR/GBP isn’t the best pair to trade breakouts with because the resulting price movements can be quite small on occasions.
Nevertheless it might be worth watching to see if the price can close decisively below this channel for an opportunity to open a short position. It may also be worth waiting for a downward breakout followed by a retracement and then a secondary price move downwards for confirmation of a breakout, although you then run the risk of missing out altogether if there is no retracement at all, which can sometimes happen.
It all depends on where the price goes from here. This lower trendline may in fact act as support once again, and subsequently push the price back up to the upper trendline, making new highs in the process.
If it does so, there is strong resistance at the top of the trendline, and further resistance at 0.9300 if the price breaks through the upper trendline because this was the high of 2017, and is also a round number that has a lot of significance in the eyes of traders.