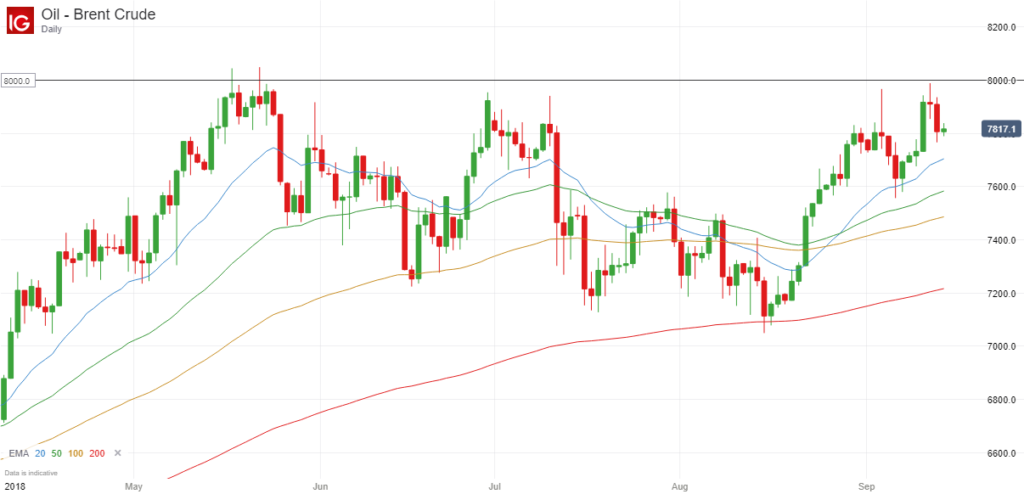
Brent Crude Price Action (2016-2018)
The price of Brent Crude dropped below $30 back in 2016, resulting in sharp share price falls for all of the listed oil companies.
Since then the price of Brent oil has risen steadily over time, and although it is nowhere near its all-time highs, it now stands at $78.18, which is a very strong recovery. As you might expect, the share price of all of the major oil companies has risen sharply as a result, and many oil traders have made some decent profits as well.
Recent Price Action
From a trading perspective, the long-term history of the Brent Crude oil price doesn’t matter too much, but if you look at how this commodity has traded in 2018, the price action is a lot more significant and could affect how you trade in the future.
That’s because it is clear that $8000 has acted as strong resistance on several occasions since May, and continues to act as resistance even now in September 2018.

Just a few days ago the price hit a high of $79.89, but was quickly sold off shortly afterwards, and the daily candle ended up being a doji candle, which indicates indecision and a lack of momentum to take it higher.
Subsequently when the price dropped below the low of this doji candle the following day, this was a good opportunity to open a short position and trade the downward breakout.
Furthermore, on the rare occasions that the price has risen above $80, it has never actually closed above this level at any point.
The Significance of $80
Before I discuss possible trading opportunities, I just want to discuss the significance of round numbers once again.
There are some traders who don’t believe that these round numbers carry much weight, but in my experience these numbers are highly important and will often act as a strong support or resistance level.
As a result of this, you will often see the price reverse at these key levels, and this certainly seems to be the case here because this commodity is quickly sold off any time it gets close to this critical $80 level.
Trading Opportunities
One obvious way to trade this reoccurring trading pattern is to simply enter short positions at $80 or just below, such as $79.50 or $79.75, for example.
However I don’t necessarily like this plan because at some point the price is likely to break through this $80 level (and close above this level), which will encourage traders to go long and push the price higher, and trigger your stop loss.
A better approach is to pay attention to the candlesticks that form and try and trade the price action. For example, if there is a doji bar, like there was yesterday, you can enter short positions if the price drops below the low of this candle because this is a high probability trade that will often generate decent returns, particularly if you close half the position early for 30-50 points, for instance, move your stop loss to break even and let the other half run for as long as possible.
Similarly, if there is a large candlestick when the price gets close to $80, followed by at least two or three inside bars, you could wait for the price to close below the initial set-up bar before entering a new short position because this will signify that there is a downward breakout.
The point is that you should pay attention to these key levels of support and resistance because the markets will pay close attention to them and trade accordingly. Therefore the resulting price reversals can be both predictable and profitable to trade if you get the right set-ups.