Introduction
As I am based in the UK, I don’t generally like to trade on Friday afternoons when the US markets open. I prefer to close out any positions before then and finish early for the week.
That’s because Friday’s price action can be difficult to predict, and if a trade does move against you, it is a horrible feeling to take a loss at the end of the week heading into the weekend.
The alternative is to hold a position over the weekend, but it can be very expensive because of the additional fees, and you run the risk of the market gapping up or down when it opens the following week, incurring even greater losses.
So I didn’t trade the S&P 500 at all yesterday, and didn’t even look at it until it closed, but I did notice a very high probability short set-up that I missed, and thought that it was worth discussing it in more detail.
Bearish Sentiment
With everything that is happening in the middle East right now, I think most traders would naturally be nervous about holding any long positions over the weekend, and may well have been looking for opportunities to short the S&P 500, expecting a sell-off heading into the close.
As it turns out, this is exactly what happened, and looking at the price action, there was an excellent opportunity to go short right in the middle of the session, prior to this.
VWAP and Fibonacci Confluence
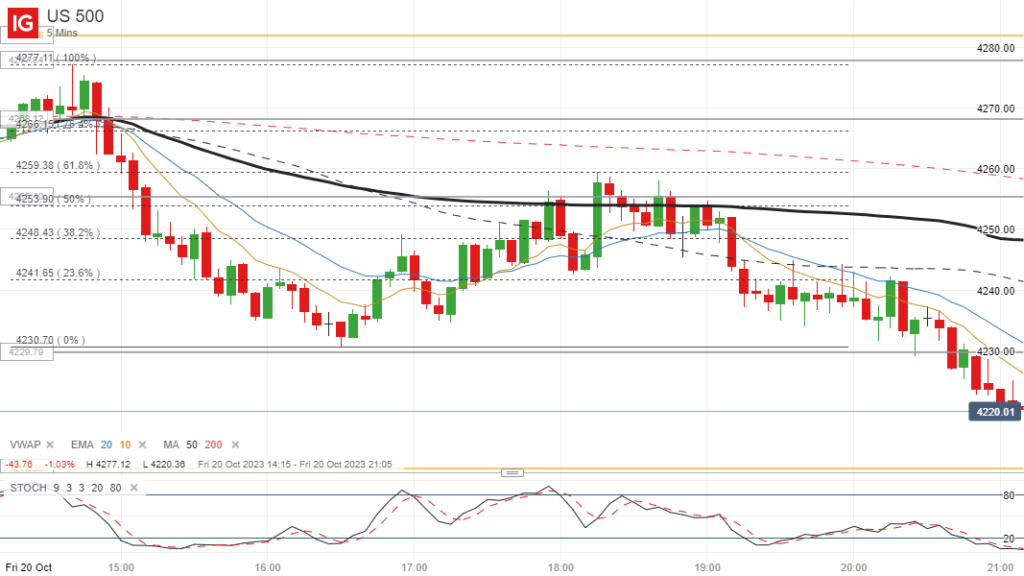
The S&P500 was relatively strong at the open, hitting a high of around 4277, before the sellers and shorters came in, driving the price all the way down to a low of around 4230.
Some traders will have attempted to short the opening rally, expecting a sell-off, and some momentum traders will have jumped on board during this downward move, but traders who were late to the party still had a good chance to short the subsequent pull-back rally.
By applying the fibonacci tool to the high and the low of this downward move, you could have easily identified potential reversal points at the key 50% and 61.8% fib levels, and if you use the VWAP, like so many other traders, you will see that this indicator was sitting very close to these key levels as well, creating another strong resistance level that the price has to get through.

Subsequent Price Action
As you can see from the 5-minute chart of the S&P500, the 50% fib level and the VWAP (shown as a thick black line) were at exactly the same level initially, and the price immediately sold off at this area of confluence, as you might expect, giving a maximum profit of around 12 points.
The price then bounced back and briefly broke through the VWAP, attempting to test the important 61.8% level, but after making two attempts, this also acted as a strong resistance level and the price ended up making a decisive move below the VWAP back to the lows of the day.
Final Thoughts
The main point that I want to get across in this article is that when you have the VWAP and some key fibonacci levels at the same price levels, particularly after a big price move beforehand, this can present you with a high probability trading opportunity.
Traders will always be looking to trade VWAP reversals anyway, and if you have a strong 50% or 61.8% level close by (or both), this will only add to their conviction.
In this case you also had very bearish sentiment and nervousness about the markets generally due to geopolitical tensions, so all of these factors combined to give traders a very nice short set-up.
I know many traders don’t like to use fib levels, but this is one more tool that you can use to tilt the odds in your favour, so it should never be disgarded completely.
If you missed this particular trade, like myself, don’t worry because there will be always be many more like this in the future. You just need to keep your eye out for them.

Leave a Reply