Introduction
The repulse indicator is quite a useful indicator to add to your charts because it essentially displays how bullish or how bearish a particular market is, and changes with every candlestick.
However it can be a little confusing because if you add it to your chart, it will show the basic repulse indicator as well as the repulse moving average and it can be hard to visually interpret what this indicator is signifying.
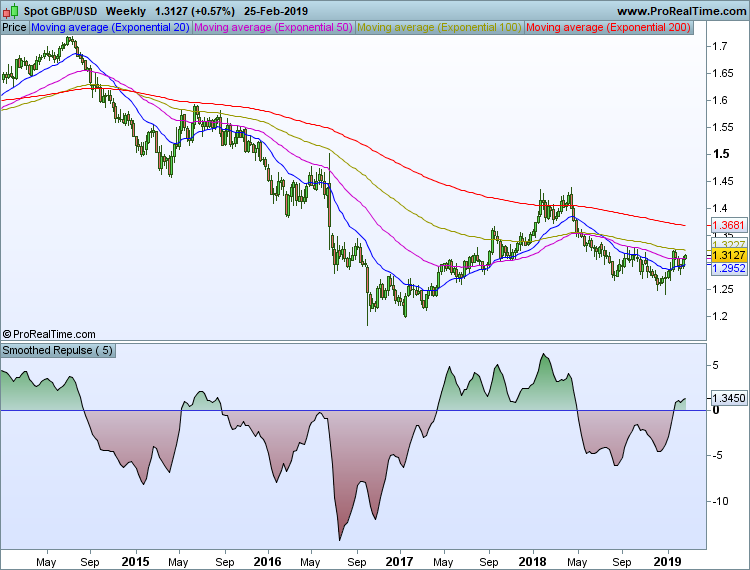
That’s why it is a good idea to consider using the smoothed repulse indicator instead. This indicator essentially smooths out the standard repulse indicator and gives a clear indication of the trend and the market sentiment because it just consists of a single oscillating line, as you can see below:

How to Use the Smoothed Repulse Indicator
This indicator is very easy to use because it indicates a bullish trend when it is above 0, and a bearish trend when it is below 0. It also indicates a change of trend when it crosses above or below this 0 level.
Therefore you should only really consider opening long positions when it is above 0 and short positions when it is below 0.
However if you do like to trade price reversals, you can also look for divergence on this indicator to see when an upward or downward trend is starting to run out of momentum, just as you would when using the RSI or CCI indicator, for example.
Best Settings to Use
The default setting for the number of periods is 5, and I have found that this is generally the best setting to use.
However if you are a short-term day trader, you might prefer to use a setting of 1, for example, and if you want to view the longer-term trend, you might prefer to use a setting of 15 periods instead.
Alternatively, you could simply add a 1, 5 and 15-period smoothed repulse indicator to your chart to highlight the short, medium and long-term trader sentiment, and get a better idea of the prevailing trend right now.
You could also use the smoothed repulse indicator to indicate the trend on a longer time frame, and then simply wait for the indicator to cross above or below 0 in the same direction as this trend on a lower time frame. There are many different ways you can use this oscillating indicator.
Limitations
As with any technical indicator, the smoothed repulse indicator does have its limitations. For example, in a sideways market, it will fluctuate above and below the 0 line and not give any clear signals, particularly on the lower settings.
Indeed if you are trading the change in trend, you may well find that you are continually being stopped out when this occurs.
Apart from this, the only other drawback is that it cannot really be used to indicate when a particular market is overbought or oversold because it is more of a dynamic indicator that is used to highlight trader sentiment.
However this isn’t too much of a problem because it still gives fairly reliable reversal signals when there is obvious divergence on this indicator.
Where to Find This Indicator
If you would like to use this smoothed repulse indicator to trade the markets, you can find it on the ProRealTime platform.
If you don’t subscribe to this charting platform, you can still use this indicator if your chosen broker uses the ProRealTime platform and offers it free of charge to their clients.
Alternatively, if you prefer to use MetaTrader, I understand that you can now download it to MetaTrader 5. A downlink link can be found on this page.
Final Thoughts
Overall, I would say that you might not necessarily want to use the smoothed repulse indicator in isolation because it can give mixed signals when it keeps crossing above and below the 0 line.
However it is generally very useful on the longer time frames (or when you use a higher period setting), and is still very good at showing the overall sentiment of a particular forex pair or market on pretty much any time frame with the default setting of 5.
So you should definitely consider using it if you have access to the ProRealTime or MetaTrader 5 platform.

Leave a Reply