Trading Bitcoin
After the European Securities and Markets Authority increased cryptocurrency margin rates to 50%, it has obviously become a lot more expensive to trade Bitcoin and other cryptocurrencies, and a lot less appealing.
The spreads can also be quite off-putting as well because even if your broker does offer Bitcoin trading, you may need the price to move 50-200 points (or more) just to break even.
Nevertheless those that do have enough capital in their trading accounts can still potentially benefit from some big price swings because this is still quite a volatile market to trade, and when the price does start moving, it can easily move upwards of 1000-2000 points in just a few days.
Inside Bar Breakout
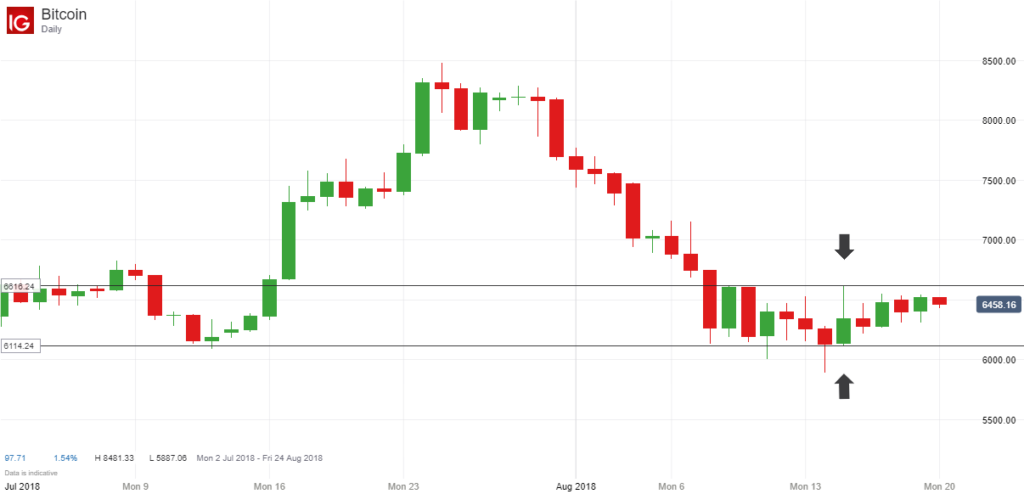
Many people are sceptical about treating these cryptocurrencies the same as any other market, and using the same kind of technical analysis to find profitable trading opportunities, but based on previous price action, it does seem to be very profitable to trade any breakouts that occur.
That’s why I wanted to highlight the current price action because the price of Bitcoin has been trading in a sideways range just recently, and more significantly, the last 5 daily candles are all inside bars, ie the last 5 candles are all within the high and low of the large candle from 15 August (indicated by the arrows), which had a daily range of around 500 points.

How To Trade
A lot of traders have their own personal inside bar and breakout strategies that they like to use, but I myself like to enter a new position when the price moves above the high or below the low of the initial candle and CLOSES above or below this candle.
In my experience, you don’t want the breakout candle to be too large, but you don’t really want the breakout candle to be one that has a small trading range either because this could be a false breakout.
Anyway I just wanted to share my thoughts on the latest Bitcoin trading action, and explain how I like to trade these breakouts when they occur.
Whether the price moves strongly higher or strongly lower after the price closes above the initial candle remains to be seen, but it will be interesting to watch what happens regardless because the price has barely moved in the last few weeks.
An upward breakout could see the price test its recent highs of around $8500, whilst a downward breakout could potentially see the price collapse if it breaches its recent low of $5887 from last week and its previous low of $5769 from June.
Please note I am not offering any advice or recommending any trades. You should always do your own research and make your own decisions before entering a position.

Leave a Reply