Introduction
I’ve been asked several times to document some trades that are based on multi-timeframe analysis because people seem to really resonate with this particular trading strategy, so in today’s article I want to discuss a very nice set-up that occurred on US crude oil yesterday afternoon.
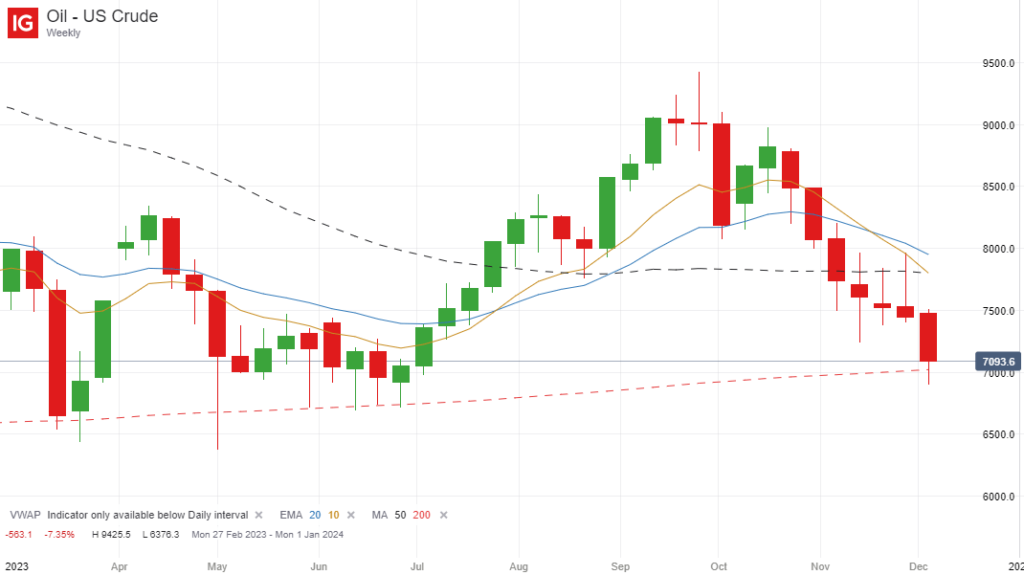
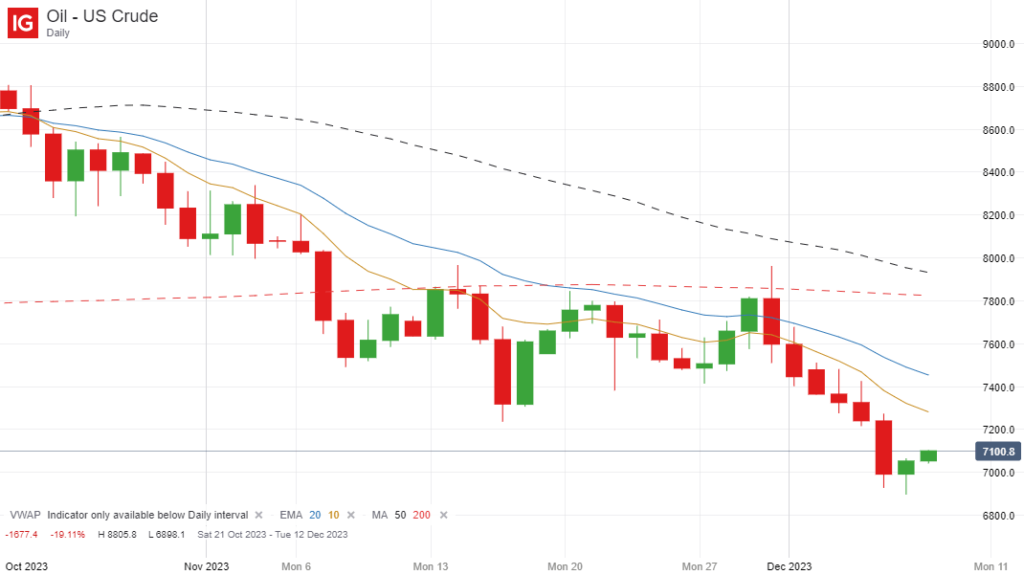
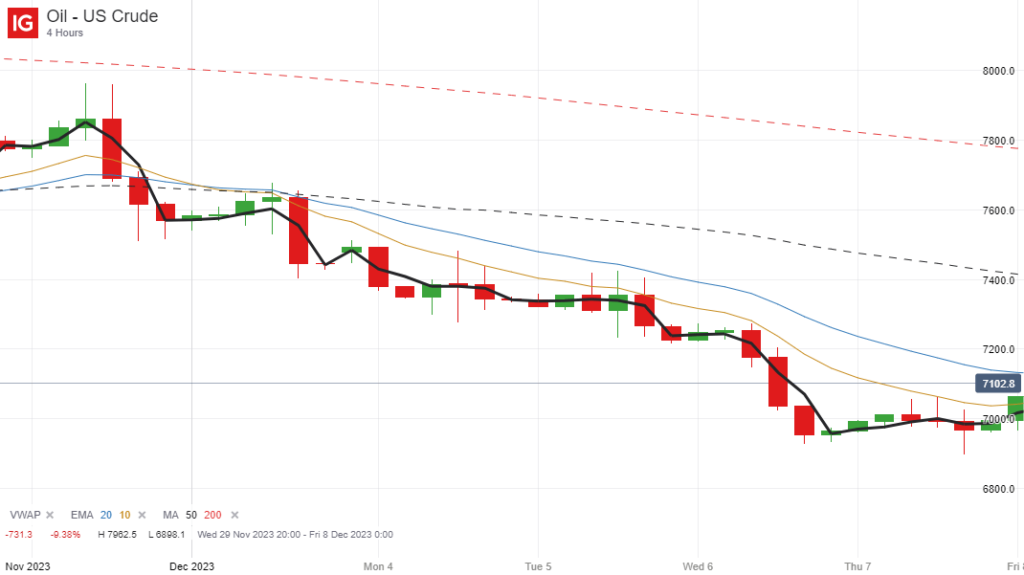
With multi-timeframe analysis I like the weekly, daily and 4-hour charts to be trending in the same direction, with the price ideally above or below their 10 and 20-period moving averages on each one.
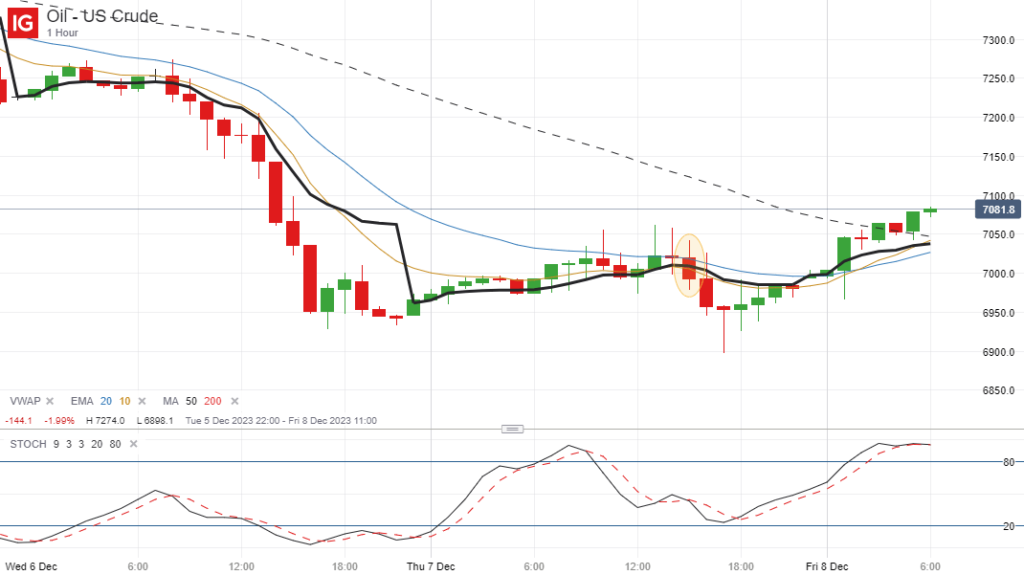
Then I want to see a pullback on the 1-hour chart followed by a trend resumption in alignment with the three longer term charts, which is where I will enter a position.
US Crude Oil Set-Up
In the case of US crude oil, the price has been trending downwards on the weekly and daily chart for a while now, and was showing a little more strength on the 4-hour chart. However it was still trading below my preferred moving averages (the 10 and 20 EMA) on this timeframe too, as you can see below:


This is exactly what I was hoping to see, and it was actually perfectly set-up for a 1-hour pull-back and entry on Wednesday, but I was reluctant to trade on that day because the crude oil inventories figure was due to be released later in the afternoon, and could have had a positive or a negative effect on the trade.
As it turned out, this would have been a very profitable trade as it moved strongly downwards prior to the data release, but luckily there was another nice set-up on Thursday where the price resumed its downward trend after a brief pullback.

Trade Entry
As you can see, there were actually two potential set-ups earlier in the day, at the close of the 5.00 and 11.00 candles, but these were low probability trades because they occurred during the quietest periods of the day when volume for US crude oil is very light. So there was unlikely to be any strong momentum behind any downward move even if the trend were to continue.
The close of the highlighted 3PM candle was a much better set-up even though it was a little late in the day because it was a bigger downward candle and there was a lot more volume behind the price drop because it occurred in the first few hours of the US session.
Furthermore, if you look at the stochastics indicator in the bottom panel of the chart, you will see that there was a nice double top divergence pattern that showed that this upward price move was running out of momentum. Plus it also dropped below the black VWAP indicator as well to give a very strong signal.
If you had entered a short position at the close of the 3 PM candle (at 4 PM) at 69.927, you would have watched it move against you initially, but then fall as low as 68.98, approximately 95 points in profit, before bouncing back slightly towards the end of the day.
Since then it has continued moving higher in the overnight Asian session, but that doesn’t really matter. It still gave you enough of a move to bank some nice profits, even if you closed half the position at 50 points and were stopped out at break-even with the other half, for example.
Final Thoughts
Hopefully I have now demonstrated that this multi-timeframe strategy works well on a variety of different instruments because I have now given trading examples of this strategy for oil, gold and the USD/JPY pair.
You do still need to be selective, as I highlighted above, because you don’t want to take an entry signal at the quieter periods of the day. If you have strong volume on your side and are trading in alignment with the prevailing trend on the higher time frames, your odds of success will be much higher.

Leave a Reply