Introduction
LuxAlgo are one of the most prolific developers of TradingView indicators on the platform, and in this article I want to discuss their most recent one, the MA Sabres indicator, because I think this has a lot of potential.
This particular indicator is completely free to use, so you can simply search for it in the indicators section of TradingView and then add it to your chart.
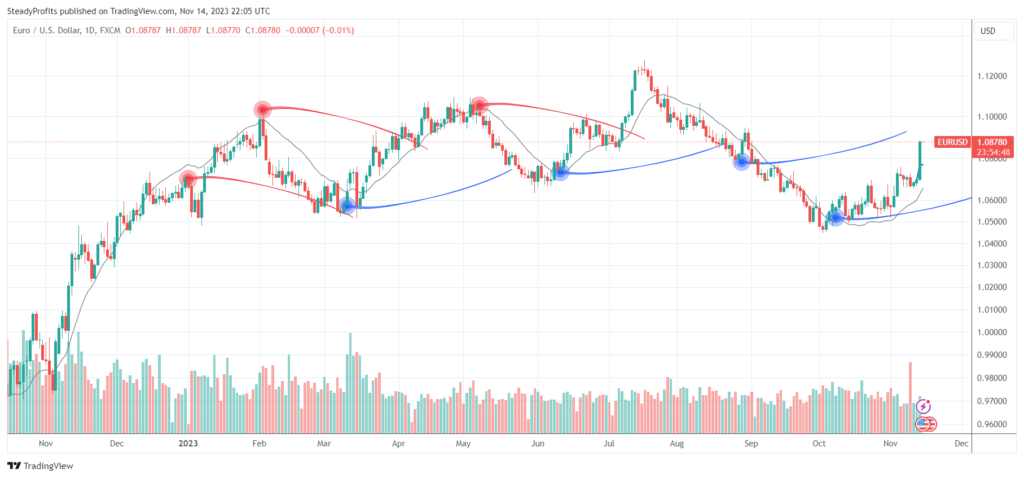
Here is the daily price chart of the GBP/USD pair to show you what it looks like once you have added it to your chart:

How to Use the MA Sabres Indicator
The MA Sabres technical indicator is based on the direction of the moving averages, as the name suggests, and indicates when there has been a major shift in trend.
Once a shift in trend is detected, the indicator will then plot a blue or red circle one bar back indicating the start of a bullish or bearish trend, and will then draw a sabre from this circle based on the ATR (average true range) over the last 14 periods.
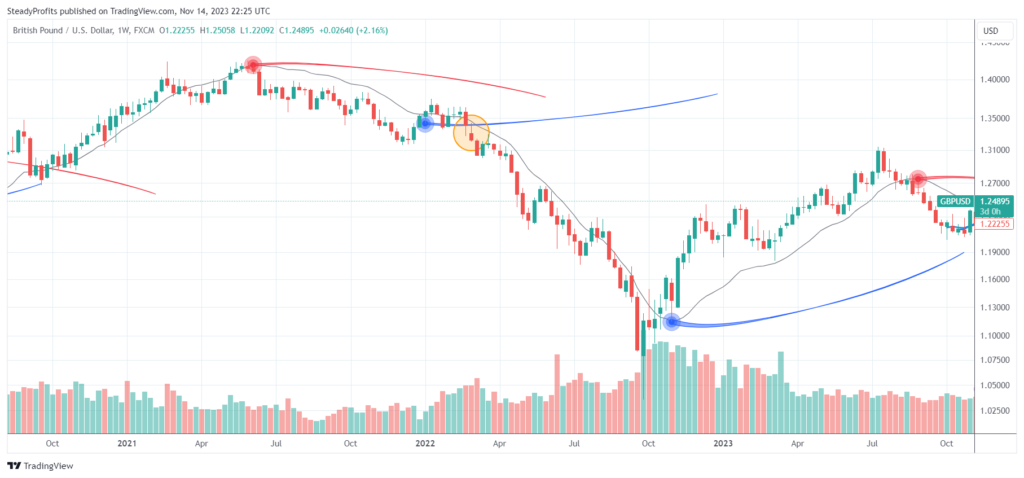
This sabre can then be used as support or resistance or as a natural level to place your stop loss if you are trading with this trend because once the price crosses back through the sabre, the trend is essentially over unless it reverses back again.
You can also trade the new breakout trend when the price moves through the sabre if it breaks through it on high volume or appears to have a lot of momentum behind it, as demonstrated here in the weekly chart of the GBP/USD pair:

Key Point to Remember
I have to admit that when I first added the MA Sabres indicator to my price chart, I hadn’t yet read any of the accompanying notes. So I thought that the circles and the sabres were being added in real time and naturally got very excited because it seemed to accurately indicate the start of a new trend nearly every time.
It was only when I read the notes that I discovered that the circles and the sabres were being plotted one bar back. Therefore the price will nearly always have moved away from the circle and the start of the sabre by the time the indicator shows up on the chart.
This is something you have to remember. The MA Sabres indicator will help to get you into a position when a new trend emerges, but not necessarily at the optimal entry point.
If the feel that the price has moved too far when the sabre is generated, you can always wait for a pullback and a continuation move before entering a position, or you could wait for the price to come back to the sabre, use this as an area of interest and wait for a strong breakout away from this level in either direction before placing a trade.
Best Timeframes to Use MA Sabres On
I have been testing this indicator out on various different timeframes, and it appears to work really well on nearly all of them.
What I like about this indicator is that it doesn’t keep printing every time there is a slight change in trend. It requires quite a significant change in the direction of the moving averages for this indicator to show up on the charts, and so even on the 1-minute chart, there won’t be lots of signals every 5 minutes.
Nevertheless, the trends are a lot shorter on these lower timeframes and there seem to be a lot more instances of the price reversing back and forth through the sabres, so I would argue that this indicator will be more effective on the longer timeframes, or on instruments that are more likely to trend in one direction if used on shorter timeframes.
Optimal MA Sabres Settings
If you go into the settings for this indicator, you will see that you can choose from several different moving averages (SMA EMA, DEMA, HullMA, etc.) and you can also adjust the length of the sabre and the duration of the previous trend from which the indicator will detect a change in trend.
The default settings are set to the TEMA (triple moving average), length = 50, trend duration = 20, and these seem to work just as well, if not better than other settings that I have tried in my early testing, especially the TEMA, but you will probbaly want to play around with these settings yourself if you choose to use this indicator.
MA Sabres Trading Strategy Idea
I am still in the early stages of testing out this indicator, but I think that the MA Sabres indicator could work really well when used alongside Brian Shannon’s anchored VWAP, for example.
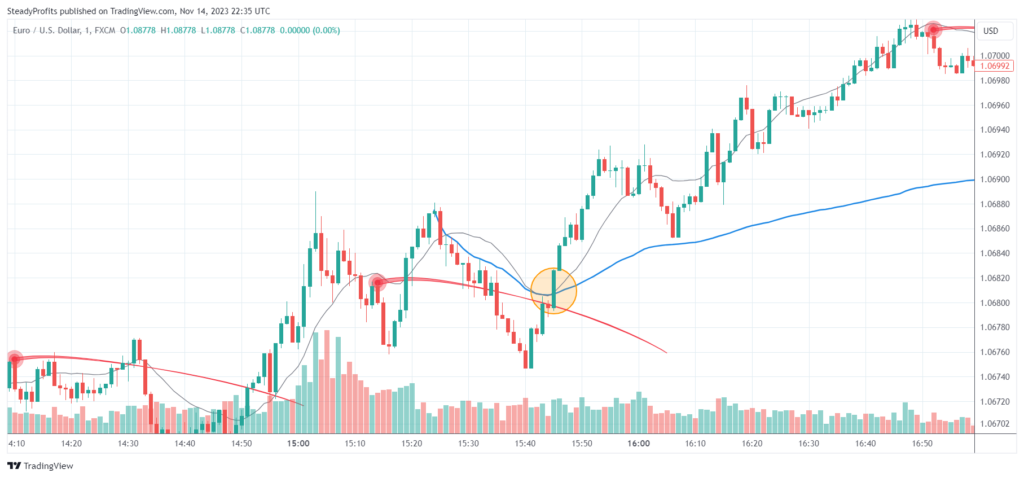
If you anchor a VWAP to a relevant high or low (or both), this will give you two major areas of interest instead of one, and if these both converge in the same place on the chart, you have a huge support or resistance level.
Therefore if the price were to pause in this area before breaking out strongly in one direction, this would give you a very strong signal.
To give you an example, here is a 1-minute chart of the EUR/USD pair showing the price breaking strongly upwards the bearish MA Sabres indicator and an anchored VWAP from a nearby high:

Final Thoughts
LuxAlgo’s MA Sabres indicator is definitely worth experimenting with because although it won’t get you into a new trend right at the start, it will signal a major change in direction.
You then have the option of trading with this new trend, or waiting for a pullback to the sabre line to see how it reacts at this key area before making a decision to go long or short.
As mentioned above, you could either use it in isolation or combine it with another indicator, such as the anchored VWAP, for example, to find even stronger areas of confluence.
I intend to do a lot more testing on this indicator, but in the meantime if you have tried using it yourself and would to like to offer some feedback, please feel free to leave a comment below.
Where to Find the MA Sabres Indicator
This is a relatively new indicator so it is only available on the TradingView platform at the time of writing (simply search for MA Sabres in the indicators section), where it has been named as one of the Editors’ Picks.
However it should be available to download on the MT4 and MT5 platforms (and others) in due course.
(All of the charts on this page are taken from TradingView.com)

Leave a Reply