Trade Set-Up
The tragic events that took place in Gaza over the weekend unsurprisingly caused the price of oil to spike sharply upwards on Sunday evening and into the early hours of Monday morning.
However after hitting a high of $86.11, the price of US crude oil price subsequently dropped back, and much to the surprise of many oil traders, it did in fact trade sideways in a fairly subdued manner on Monday and Tuesday.
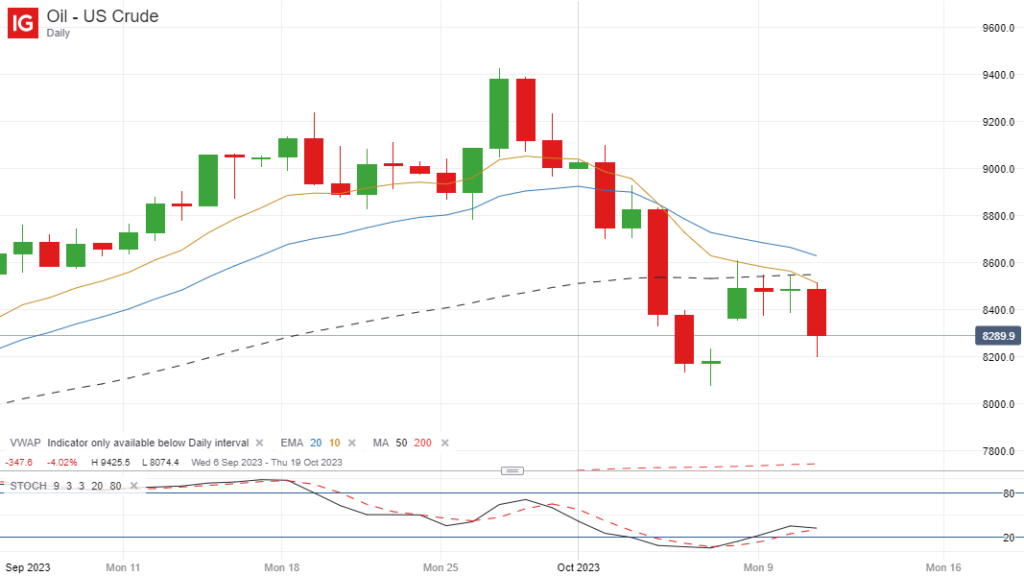
This set up an excellent trading opportunity for breakout traders because if you check out the daily chart below, you will see that there was a double inside bar set-up, with both bars trading within the range of Sunday’s bar, which is generally a high probability set-up:

Trade Execution
When you get a set-up like this, you can either wait for the price to break the high of Tuesday’s candle to go long, or wait for the price to break the low to go short.
For extra confirmation, you can wait for a breakout on a lower timeframe, followed by a retest and then a continuation breakout, but by doing this, you run the risk of missing the trade altogether if the price drives straight through the high or the low without pulling back to the entry level.
A lot depends on the pre-breakout price action. Ideally you want the price to consolidate near the breakout level for several candles, because then the price has the potential to move a lot further from the breakout level straight away, but this didn’t occur here.
Anyone taking the breakout on the 5-minute price chart, for example, would have noticed that there was a lot of choppy price action after the initial breakout, as well as a few price moves back above $84.00 that may have taken them out before the big drop lower occurred if they used a relatively tight stop loss on this lower timeframe.
That’s why it’s often better just to stick to the daily chart when trading inside bar breakouts, reduce your trade size and use wider stop losses instead.
If you had done that here, you could have entered a short position on the breakout, placed your stop loss at yesterday’s high and still banked an excellent profit based on a 1:1 risk reward, without having to worry about short-term volatility.
Indeed you wouldn’t have even seen this initial volatility on the daily chart if you were looking at the chart at the end of the day.
Closing Comments
I didn’t take this trade myself because I was away from my computer this afternoon, but I just wanted to discuss this set-up on US crude oil because you don’t see these double inside bars very often, particularly on a volatile market such as oil.
However they are always worth paying attention to because when the price does eventually break the high or the low of the most recent inside bar, you can get some very big price moves in the direction of the breakout, as was the case here with a price drop of over 180 points from the breakout level.

Leave a Reply