Introduction
Many traders are sceptical about whether or not you can find high probability set-ups on the lower timeframes because the price can move around so fast, and seemingly at random a lot of the time.
However I believe that it is still possible to find good quality trades on these lower timeframes because I regularly take these trades myself on the 5-minute chart of the major stock market indices, and tend to have a decent hit rate.
Some of the very best traders just use price action alone to find high probability trades, such as Al Brooks, for example, but I like to have a few additional indicators on the chart for guidance.
These include the VWAP indicator, the stochastic indicator and several moving averages, and just yesterday (26 January 2024) they all combined to provide a high probability set-up on the S&P 500, as I will demonstrate in the rest of this article.
The Set-Up
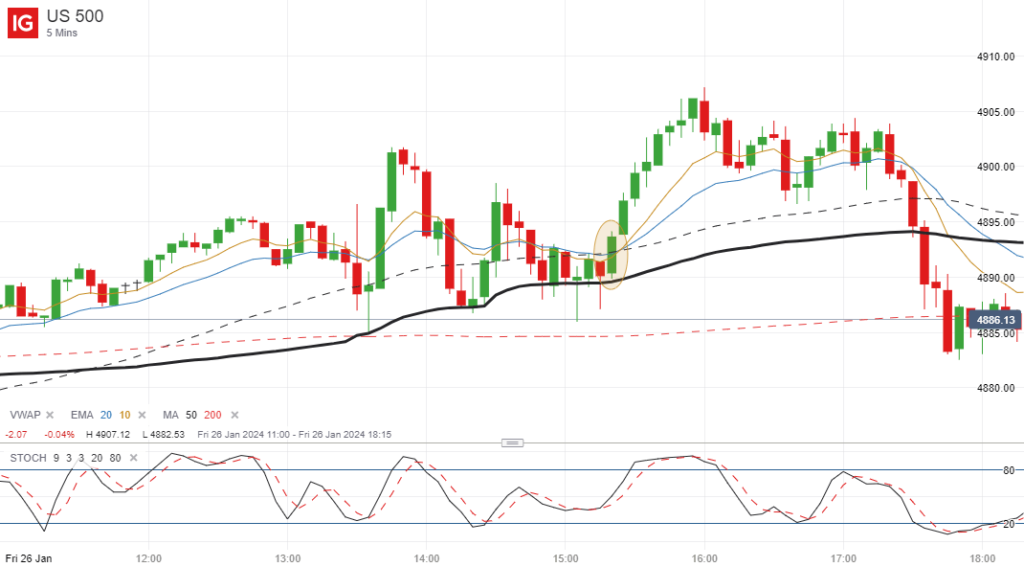
As you can see in the 5-minute chart below, the price of the S&P 500 opened slightly higher when the market opened at 14.30 (UK time) before dropping back towards the VWAP indicator (shown in black), where we saw a lot of sideways price action and indecision around this key indicator.
Crucially, the price failed to close below the VWAP and was also trading close to the 10, 20 and 50-period exponential moving averages, so this was all pointing to a possible breakout.

Trade Execution
I was already going into the trading session with a bias to the long side because the trend was so bullish on the higher timeframes.
So when the price bounced off the VWAP, and closed above these three moving averages with one very strong 5-minute candle, I was ready to enter a long trade if the price broke the high of this candle, which it duly did.
The fact that the price closed above the highs of the previous 6 candles and was showing significant divergence on the stochastic indicator at the bottom of the chart just gave me added confidence that this was going to be a strong breakout.
I ended up entering a long position on this initial breakout at 4894.4 and closed half the position at 4900 because this was a major round number that could have acted as strong resistance, and the other half at 4905 after the price had continued pushing higher without any red candles.
As a result, I banked a total profit of just over 8 points from the two positions combined.
Closing Comments
You can see from the chart above that the price of the S&P 500 subsequently dropped back later in the session, but that was irrelevant.
The point is that at that particular time, the indicators and price action were all pointing to a breakout to the long side, and when I see a confluence of indicators like this and a tightness of price action prior to the breakout, this is a time when I like to take a position.
It is rare to see the price of this particular market trading in a narrow sideways range around key indicators at the start of a session, but when you do, you know that in most cases there will eventually be a breakout and a strong surge in one direction or the other, even if it doesn’t last for the whole day.
So it is always worth keeping an eye out for these high probability set-ups because they do come up on a regular basis, even on the 5-minute chart, which is my preferred shorter term timeframe.
They won’t always be profitable of course, but by using tight stop losses, there should be more winning trades than losing trades, and the profits from these trades should exceed any losses that you may incur.

Leave a Reply