Introduction
I was recently asked to provide a few more examples regarding the multi-timeframe strategy that I like to use to trade the forex and commodity markets, so in this article I want to break down a gold trade from earlier this week that was based on this strategy.
Just to reiterate what I said in the previous USD/JPY trade example, what you are looking for with this strategy is for a market to be trending strongly in the same direction on two or three different timeframes, and temporarily pulling back on a shorter time frame.
Then you want to wait for a strong signal that the longer term trade has resumed on this shorter time frame so that you can then jump in and take the trade with the underlying trend.
Although there will always be false price moves, the reality is that when four different timeframes are in alignment in terms of the overall trend, the odds of success are greatly enhanced.
Underlying Gold Trend
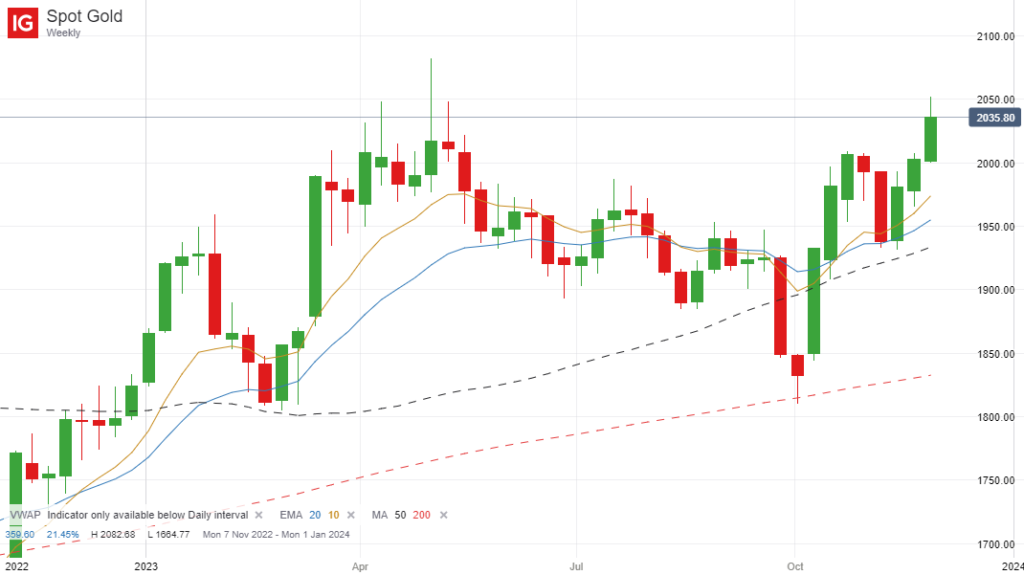
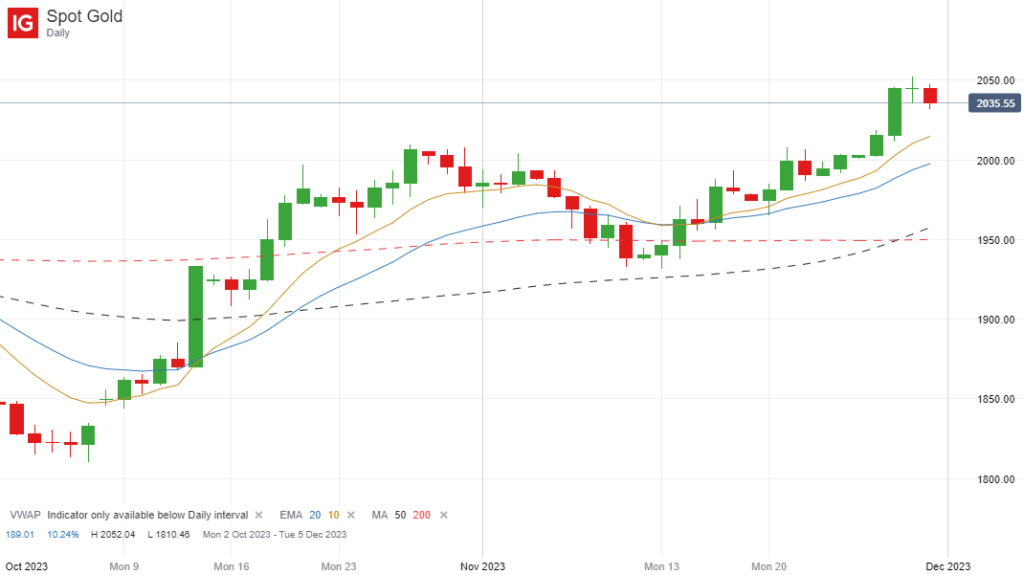
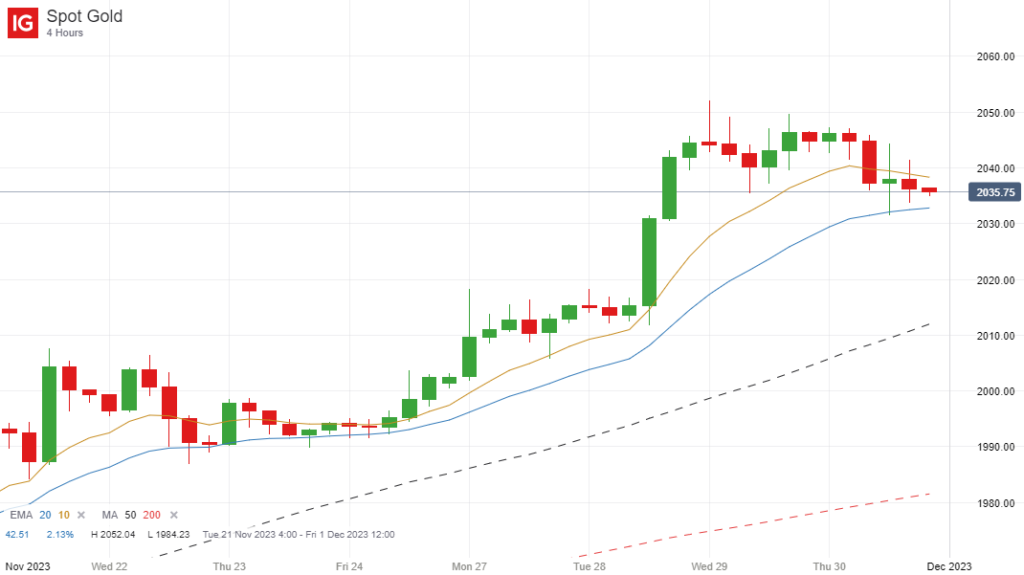
Diving straight into the trade breakdown of gold, if we take a look at the weekly, daily and 4-hour charts, we can see that the price was above my two preferred moving averages, the EMA(10) and EMA(20), on all three of these timeframes as we started the week:


Indeed it was actually above the EMA(50) and EMA(200) on all of these timeframes as well, which just underlines how strongly the price of gold has been trending upwards in recent times.
Waiting For a Pullback
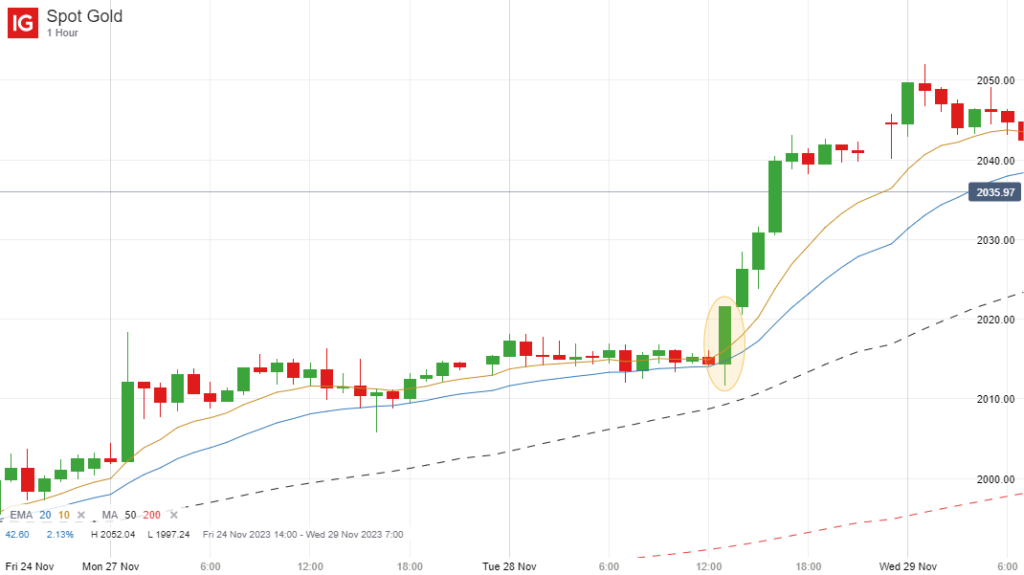
The next step is to drop down to the 1-hour chart and wait for a pullback to the EMA(10) and EMA(20) moving averages. Ideally we want to see the price actually dropping below these moving averages before breaking upwards once again and starting a new upward leg on this lower timeframe.
As you can see from the chart below, the price did just this on Tuesday morning, and there was subsequently some very nice consolidation within a very tight band between the 10 and 20-period moving averages:

When this happens, there is often a strong breakout about to emerge, and in this case it was an upward breakout just before the US market opened later that day, which is exactly what we wanted to see because the trend was already bullish on the three higher timeframes mentioned earlier.
Then it is just a matter of entering a long position on the close of this strong breakout candle, which I have highlighted on the chart, or taking a chance that there will be a slight pullback after the close of the candle that will allow you to enter at a slightly better price.
Trade Outcome
If you entered at the close of the 1-hour breakout candle at $2021.56, you could have banked up to $21.53 profit because the price hit a high of $2043.09 later that afternoon, and actually hit a high of $2052 overnight.
So this demonstrates the effectiveness of this multi-timeframe strategy if you wait for a pullback on the shorter timeframe and then enter a position on a resumption of the underlying trend from the three higher timeframes.
Not every trade will work out of course, but if you always trade with the trend, you should hopefully win more times than you lose if you wait for the best entries.

Leave a Reply