Death Cross
If you are a regular reader of this site, you will know that I recently posted about the death cross that has just occurred on the weekly chart of gold.
This is basically where the 50-period moving average crosses below the 200-period moving average, and is generally considered to be a very bearish signal.
Since then the death cross has been confirmed, but it hasn’t resulted in a wave of sellers using this as an opportunity to drive the price lower.
This is not unexpected because these weekly signals can take a long time to unwind, but if you drop down to the daily chart, you will see that the price is really struggling for direction right now.
Narrow Trading Range
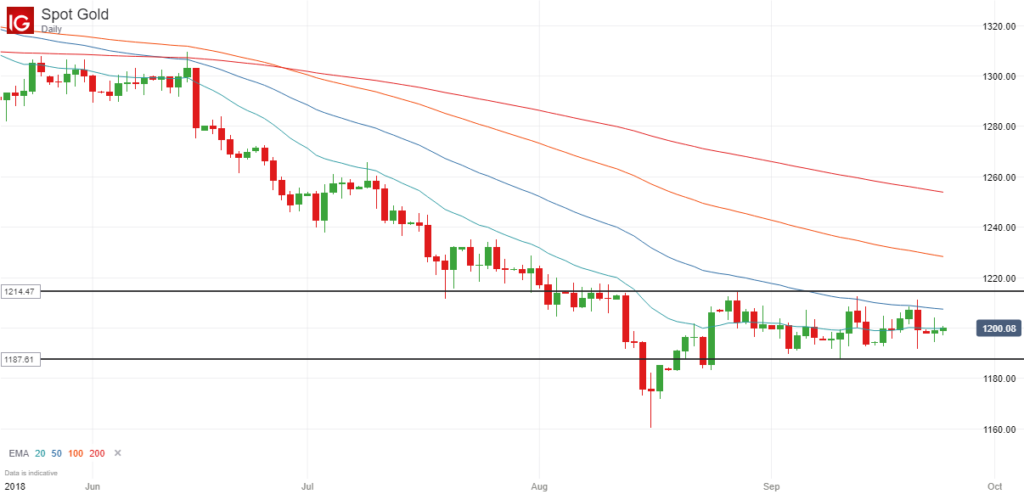
In recent weeks the price seems to have been glued to the critical $1200 level, and has struggled to break decisively above or below this significant round number with any real momentum or conviction, as you can see below:

So far this month it has recorded a low of $1187.8 and a high of $1214.4, but has remained in a very narrow trading range for several weeks now.
Inside Bar
In addition to trading in a very narrow range, we have also had a series of three consecutive inside bars in the last three trading sessions (if you include the Sunday session), which is always worth noting because these inside bar patterns will often present you with a profitable breakout opportunity when the price closes above or below the initial set-up bar.
Trading Opportunity
From a trading perspective, it is very hard to trade any instrument that is basically trading sideways with no clear direction, but it is still good to see such a pattern because it usually leads to a profitable set-up when the price eventually breaks out of this range.
This is particularly true when you have a series of inside bars within this sideways trading range, as is the case here.
Therefore it might be worth watching the price of gold in the coming weeks because there could be a strong price move when the price closes above or below both the set-up bar and the previous high or low of this trading range.
A downward break would arguably be preferable because we have already seen a death cross on the weekly chart, and there could subsequently be a lot of downside potential.
Nevertheless, an upward price breakout could still be worth trading because there is always the potential for the price to move back towards the 200-day exponential moving average or the 100-day exponential moving average, which currently stand at $1253.9 and $1228.3 respectively, before heading south once again.
The point is that these sideways trading ranges and inside bar formations can be very profitable to trade because in many cases the longer it remains in the range, and the longer the price trades within the initial set-up bar, the bigger the breakout once the price closes outside of this range.
To demonstrate this point, you only have to check out these two inside bar range breakouts that occurred on Bitcoin and the GBP/JPY pair last month.

Leave a Reply