Gold Price Action
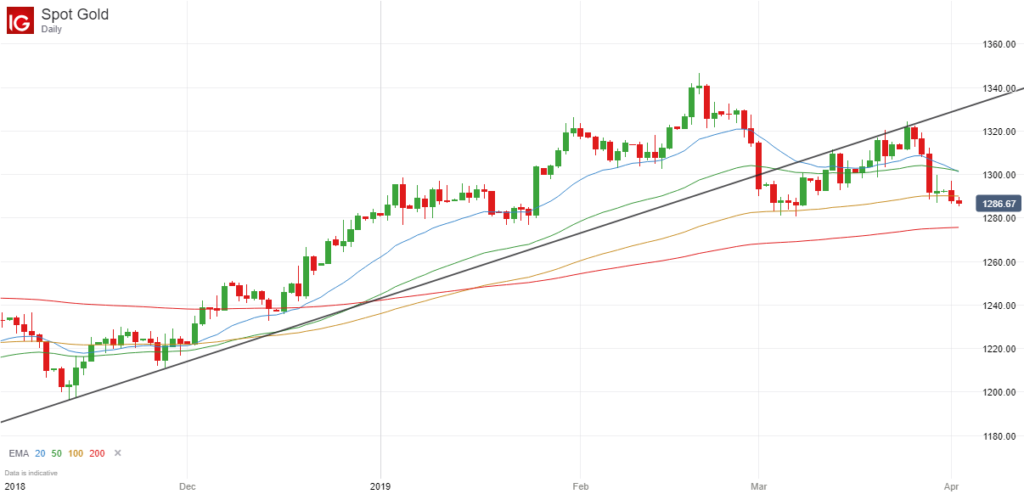
If you look at the long-term daily chart of gold, you will see that the price has been steadily rising upwards since the end of 2018.
As you can see from the chart below, the trendline marking the two lowest points at the start of this move has been a good guide because the price stayed above this trendline for many weeks and months and never really threatened to go below this line.

Indeed the price crossed above the 200-day exponential moving average, as did the 20, 50 and 100-day moving averages, highlighting a very strong upward move.
The price actually reached a high of around $1346, but it has since fallen below this trendline, but the interesting thing is that this trendline is now acting as resistance.
Trendline Resistance
This occurs quite often in the financial markets. A trendline that previously acted as support is now acting as resistance, and the reason why is because traders and financial institutions are always looking for strong areas of support or resistance to place their trades, and this is one such example.
In this case, after breaking below the initial trendline, the price has bounced back on several occasions, but has struggled to move above this extended trendline. In fact on every occasion gold has been sold off whenever it has come close to this line.
Subsequently the upward momentum finally subsided and the price is now back below the critical $1300 level at $1287.
Future Price Direction
It is quite hard to predict where the price is going to go from here, but you would have to say that it is more likely to continue falling further below $1300, particularly if the general stock markets remain strong.
The trendline is likely to continue acting as resistance if the price does bounce back, and at the current time, it is hard to see what kind of economic factors are going to drive the price above this level.
Furthermore, the 200-day moving average is starting to become significant once again because the price is only just above this key indicator.
If it were to fall below this moving average and was backed by strong volumes, then there could be a much more sustained downwards move, with price targets of $1260, $1240 and $1220 being easily achievable in the short-medium term.
Anyway the key point I wanted to make is that historical trendlines can be very significant when you are looking for areas of support and resistance, and this is a classic example of one such instance.

Leave a Reply