Introduction
I just uploaded a new article to this site a few days ago that took a closer look at the VWAP indicator, and how it can benefit stock, indices and forex traders, particularly those who like to day trade these markets on the lower timeframes.
In this article I pointed out that one of the best set-ups is when you get an initial move higher followed by a retracement back down to the VWAP indicator because this is where you will often see a strong level of support, and in many cases a nice bounce higher.
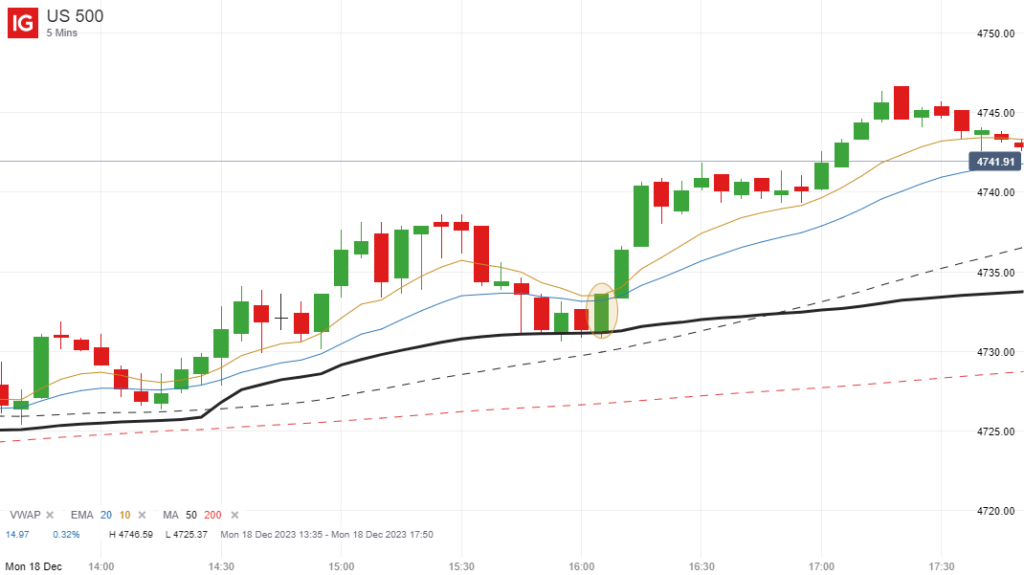
Well as it turned out, we got a textbook VWAP bounce on the S&P 500 only yesterday and it is this trade example that I want to walk you through today.
S&P 500 Trade Set-Up
As you are probably aware, the markets have been really strong in December and getting close to new all-time highs.
Subsequently, if you would have looked at the longer timeframes on the S&P 500 at the opening bell yesterday, you would have seen that the price was above the 10 and 20 exponential moving averages on the monthly timeframe all the way down to the 4-hour timeframe, and had just popped above them on the 1-hour chart as well.
Therefore the trend was ultra-bullish, and you should only really have been looking for opportunities to go long because you would really have been swimming against the tide if you had attempted to short this market.
One way of doing this is waiting for a retracement and then taking a long position when the price moves upwards through these moving averages on a lower timeframe, but VWAP bounces can be just as effective when they occur.
Obviously if you get a VWAP bounce and a move through the moving averages, that’s even better!
Trade Execution
In the case of yesterday’s price action on the S&P 500, we did see an initial move higher, but short-term traders will have noticed that the price started to retrace back towards the VWAP on the 5-minute chart after the first hour of trading.

As I mentioned earlier, with the underlying trend being so strong, this is the area where traders should consider going long if buyers started to step in, and the close of the highlighted candle was a good time to do so.
This is where we saw the first strong bounce off the VWAP, and we also saw the price break through the prior highs from the previous two candles as well. Plus it also closed at the high of the candle, which was another sign of strength.
You will also see that the price just about closed above both the 10 and 20-period exponential moving averages as well, so this was a really high probability set-up.
Your losses could be easily capped by placing a stop loss just underneath the most recent low, or somewhere just below the VWAP indicator, and your potential gains to the upside are essentially unlimited.
Closing Comments
It’s always important to point out that these and other similar set-ups are not completely foolproof.
There will be times when the price will look like it is bouncing back off the VWAP indicator, but then burst straight through it and continue moving lower, but if you manage your losses, this isn’t a problem and is just part of trading.
The key to successful trading is to find opportunities to put the odds of success in your favor, and trading VWAP bounces is one way of doing this if you wait for the right set-ups.

Leave a Reply