Previous Analysis From Last Month
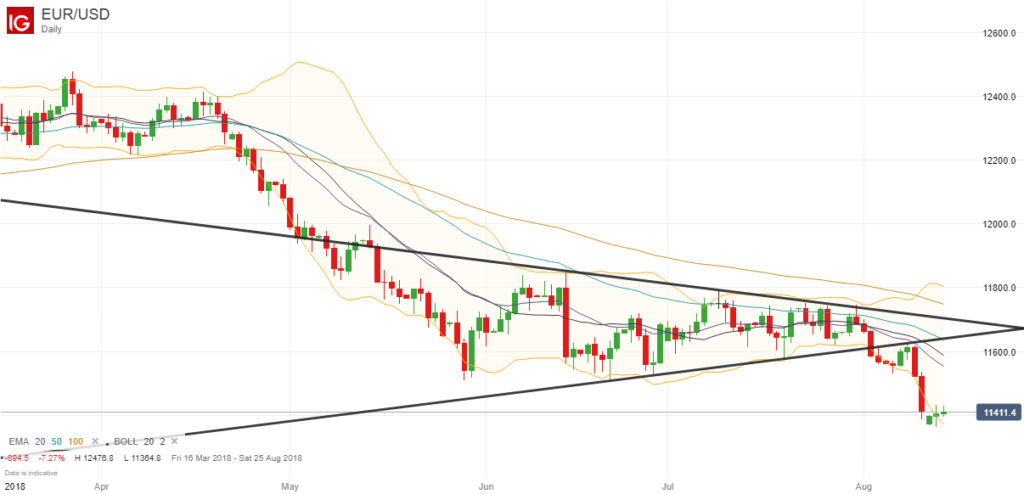
A few weeks ago I wrote this blog post discussing the low volatility of the EUR/USD pair, and showed how it was trading in an ever decreasing channel.
When you get a tightening trading range and low volatility with the exponential moving averages and bollinger bands all tightly packed together, you often get a strong breakout in one direction or the other when the price breaks out of this channel, and this is exactly what happened.
Downward Breakout During August

At the start of this month, the price finally broke downwards out of this channel (and below the outer bollinger band), closing the day at 1.1586, which we highlighted at the time on our Twitter page and our new Instagram page.
The price then continued falling during the following three trading sessions, before bouncing back for a few days. However you will see that the previous trendline acted as resistance and traders used this resistance level to open new short positions and drive the price downwards again. So there was another opportunity to go short if you missed the initial breakout.
Subsequently, if you had opened a short position at the close of the initial breakout candle, you could have yielded over 200 points so far (if you had placed your stop loss above the trendline or above the high of the breakout candle, for example), and this downwards breakout could yet yield a lot more points.
Profitability of Channel Breakouts
Whether you took this particular trade or not, I just wanted to highlight how profitable these breakout trades can be if you are patient enough to wait until a clear breakout has occurred.
Yes it can be frustrating when one of your favorite pairs is trading in a narrow trading range because the short-term moves are hard to make money from, but if you switch your attention to the daily charts, you can see some large moves on occasions, and this is one example.

Leave a Reply