Moving Average Trend Benefits
If you ask a technical trader which indicators they like to use when trading the forex markets, you can be certain that many of them will use moving averages.
That’s because these simple indicators give you an instant snapshot of the current trend in the markets.
It doesn’t matter if you are using the simple, exponential, volume or weighted moving average. If the indicator is moving higher, then the market is in an upward trend, and if it is moving lower, it is obviously in a downward trend.
The 200-Day Moving Average
You can use many different period settings for whichever moving average you like to use to immediately identify the short, medium and long-term trend at any given time, but one of the most useful and most widely used indicators that many longer term traders like to use is the 200-day moving average.
It is largely down to personal preference whether you use the simple or exponential moving average, but they both highlight the long-term trend really well.
I personally use the 200-day exponential moving average, or EMA (200) for short, and have always found it to be really useful when trading currencies and stocks.
It’s often significant when the price breaks through this EMA (200), and is equally significant when many of the shorter-term moving averages cross above or below this indicator because it will often indicate a change of trend.
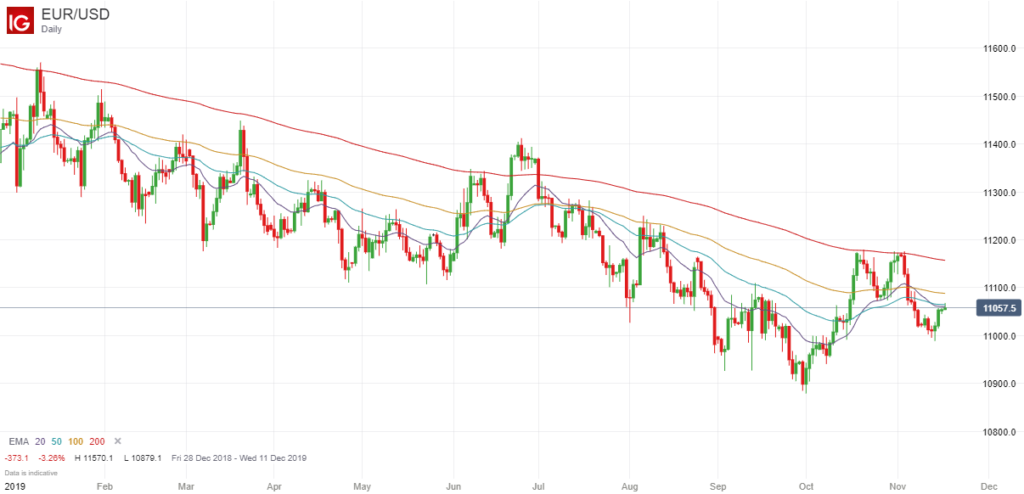
However it can often act as a strong support or resistance level, particularly after the price has risen or fallen sharply in a short space of time, and in this article I thought I would demonstrate this by showing you the daily price chart of the EUR/USD pair:

Strong Resistance in 2019
As you can see from the chart above, the price of the EUR/USD has been slowly trending downwards for much of 2019, but there have always been some mini-rallies along the way.
More importantly, you will see that on most occasions the price has not only struggled to break through this key indicator (shown in red), but has run into strong resistance and been actively driven lower every time it came close to this indicator, except for one occasion when it briefly traded slightly above particular indicator.
Conclusion
Therefore the point that I want to get across in this article is that traders pay close attention to the 200-day exponential moving average, and as a result of this, any resulting price moves almost become self-fulfilling once the price starts to move away from this key level.
On many occasions it will act as strong support or resistance, as was the case here with the EUR/USD, where you could have made some good returns going short each time the price got close to the EMA (200), but it can also signal a change of trend when it is finally broken, in which case you can also potentially make some good returns because you can get in at the start of a new trend.
So it is always worth adding the EMA (200) to your daily price chart if you like to trade this time frame.

Leave a Reply