What is a Death Cross?
A death cross occurs when a short-term moving average crosses below a long-term moving average, and is significant because it often signals the start of a new long-term bearish trend.
Traders will often use different time periods and different moving averages to find these downward crossovers, such as the 50 and 100-period simple moving averages (SMAs), for example, but 50 and 200-period exponential moving averages (EMAs) seem to be the most popular.
As always, these crossovers are more significant on the longer time frames, such as the daily and weekly time frames, and for that reason I want to alert you to a new death cross that is occurring right now on the weekly gold chart based on the EMA (50) and EMA (200).
Previous Price Action
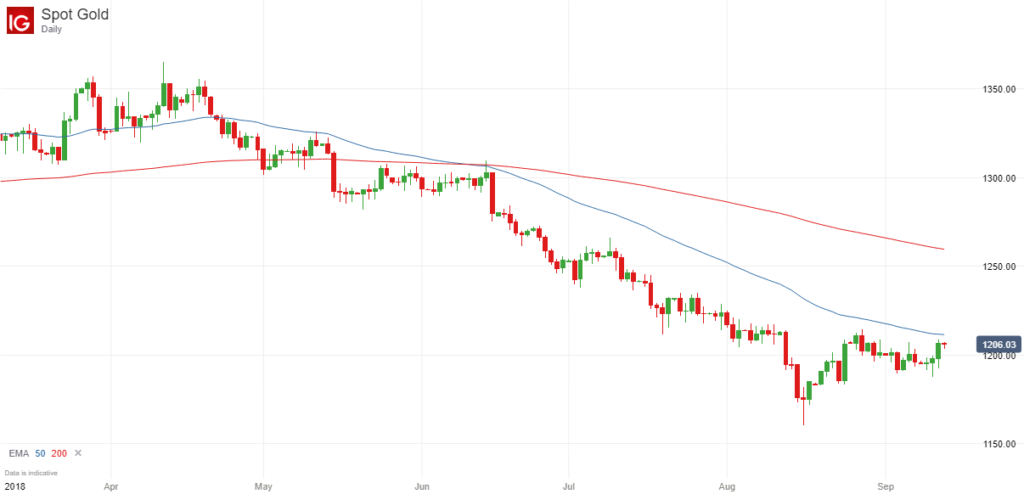
Gold traders may already be aware of the death cross that has occurred on the daily chart of this particular commodity during the summer. If not, here is the daily price chart that highlights this downward moving average crossover:

You can see that the death cross occurred during June and resulted in sustained price falls during the following months as traders continued to close long positions, sell gold and actively short this commodity, helping to drive the price down from around $1300 per ounce to just $1160 per ounce.
Since then the price has bounced back to the $1200 level and seems to have found support around this level, but ultra long-term traders may be interested to know that there is a new death cross forming on the weekly chart, which suggests that the price could still go a lot lower.
New Death Cross on Weekly Price Chart
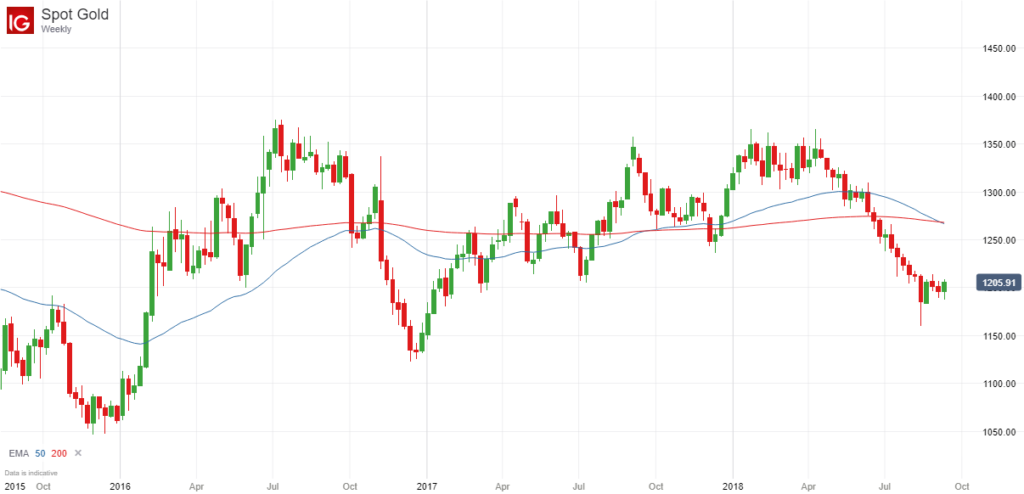
If you look at the weekly price chart of gold, you can see that the 50-week exponential moving average is crossing below the 200-week exponential moving average.

This in itself doesn’t necessarily guarantee that the price will drop a lot further in the short-term. It may well rebound in the next few weeks and come back to the EMA (200) because the price has already fallen heavily in recent months.
However the long term implications of this death cross could be significant because in the past these crossovers have resulted in some long and sustained price moves, both to the upside (in the case of a golden cross) and the downside.
Therefore it could be argued that the price of gold could potentially fall to $1000 or lower in the coming months if traders act upon this weekly death cross and continue to drive the price lower.
So it will be interesting to watch the price of gold over the course of the next few years to see if this is a significant death cross or whether the price continues to trade in a sideways range.
Trading Opportunities
I wouldn’t necessarily recommend that you actively trade these death crosses, particularly on the weekly time frame. Nevertheless they do present opportunities because you can take note of this long-term trend and look to open short positions on any pull-backs.
For example, when the death cross is in force on the weekly chart, you might want to wait for pull-backs on the daily price chart and look for opportunities to open short positions where appropriate (downward breakouts from peaks, heavily overbought conditions, strong resistance at round numbers etc).
(If you would like to trade gold, AAAFX and Ayondo are two brokers that generally offer low spreads on this commodity).

Leave a Reply