Price Action
If you have been watching the price of oil in recent weeks and months, you will know that it has been on a crazy ride just recently.
Indeed there was a brief time when the oil price actually went negative when the latest contract expired, which was an unprecedented event that has never happened before.
The price had already tumbled as a result of tensions between Saudi Arabia and Russia, followed by the sharp drop-off in demand caused by global lockdowns, but the constant shorting of oil pushed the spot price of WTI Crude Oil down to just $7 per barrel.
Breakout
As countries have started to reopen for business, the price of WTI Crude has started to slowly rise again, and in this article I want to highlight a breakout that occurred last week that you may have missed.

Inside bar breakouts are some of the most profitable breakouts you can trade if you wait for the right set-ups, and this was a decent example of a high probability set-up.
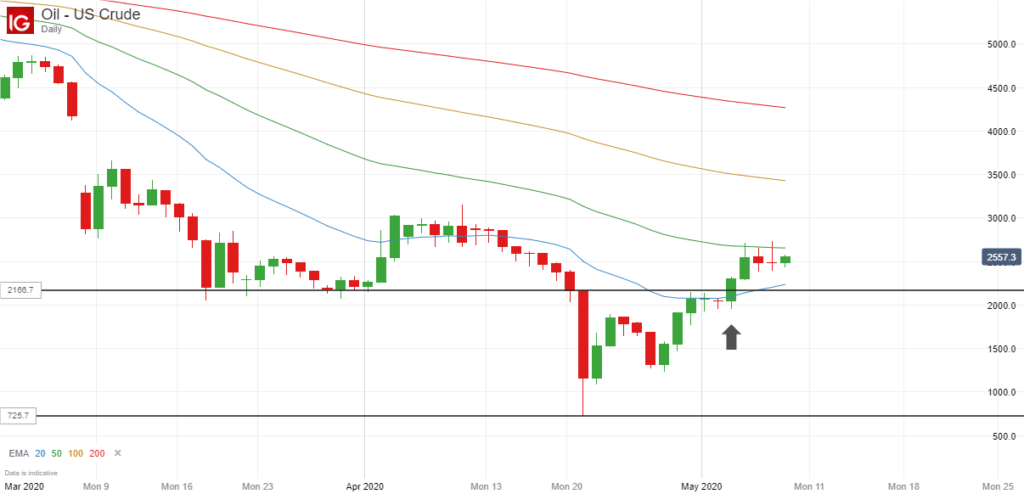
As you can see, there was initially a large red candle on 21 April 2020, but for the next ten trading sessions, the price of WTI Crude actually stayed within the entire range of this candle. So in other words, there were ten consecutive inside bars.
When this happens, there is often a strong breakout when the price finally breaks out of the range of this inside bar (and closes outside it), and that’s exactly what happened here.
On 4 May 2020, the price broke upwards out of this range and closed at almost exactly $23.
This would have been a good point to enter a long position because the price then went up to $27.15 the following day, representing a potential gain of $4.15.
Since then the price has dropped back to around the $25 mark, but I think many traders are expecting the momentum of this breakout to continue, with the price heading up towards the $30 level at some point.
Final Thoughts
I didn’t actually take this trade myself because I don’t like to trade oil on eToro (my risk score is high enough already thanks to my BP and RDSB stock holdings), but I just wanted to highlight how profitable these inside bar breakouts can be.
Just having two consecutive inside bars can be enough to give you a strong breakout trading opportunity, but it is often the case that your odds of success increase even more when you have several of these inside bars within the range of the initial candle.
That’s why I wanted to demonstrate with this example because here we had ten inside bar candles in a row, thanks to the extraordinarily large set-up candle that spooked the markets and prompted so many headlines.
It’s interesting to note that if you go back to the price chart and look at the price action before this large drop-off, you will see that there was a downward inside bar breakout just prior to this as well.
This would have got you into a short position at around $26.60, just before the big fall of nearly $20, but we can all be wise after the event, and in reality, many traders would probably have banked their profits before the price collapsed from $22 to $7.
The point is that you want to keep an eye out for these inside bar set-ups. They work really well on the longer time frames in particular, and when they occur at a peak or a trough, the resulting breakouts can potentially be large enough to give you some good gains.

Leave a Reply