Introduction
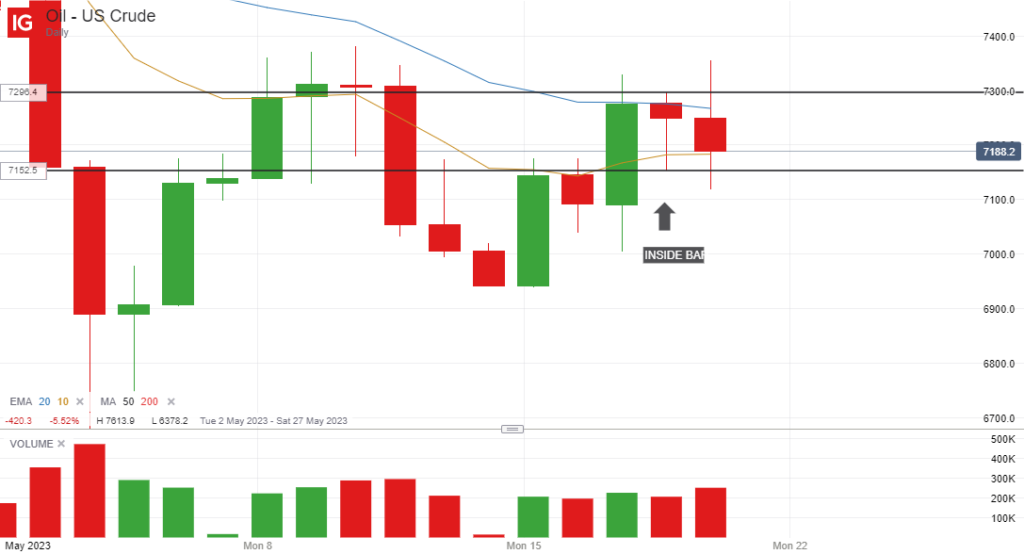
I have always been a big fan of inside bar set-ups because these provide you with a low-risk, high probability entry point that can potentially have high rewards.
You can either trade them on the shorter time frames, such as the 5 or 10-minute charts, for example, to scalp a few points, or you can use them on the 1 hour, 4 hour or daily time frame to target even bigger moves.
The reason why they work so well is because you get a wide trading range with the initial candle followed by a series of smaller indecisive candles that all trade within the range of this first bar.
So when the price does eventually break above the high or below the low of the first bar/candle, the move can be quick and decisive as it will often quickly gather momentum and continue moving in the direction of the breakout.
USD/JPY Set-Up
I wasn’t at my computer during the Asian and pre-London trading session on Friday (19 May 2023), but as I was reviewing my charts this weekend, I noticed what would have been a really great set-up on the 1 hour chart of the USD/JPY pair.
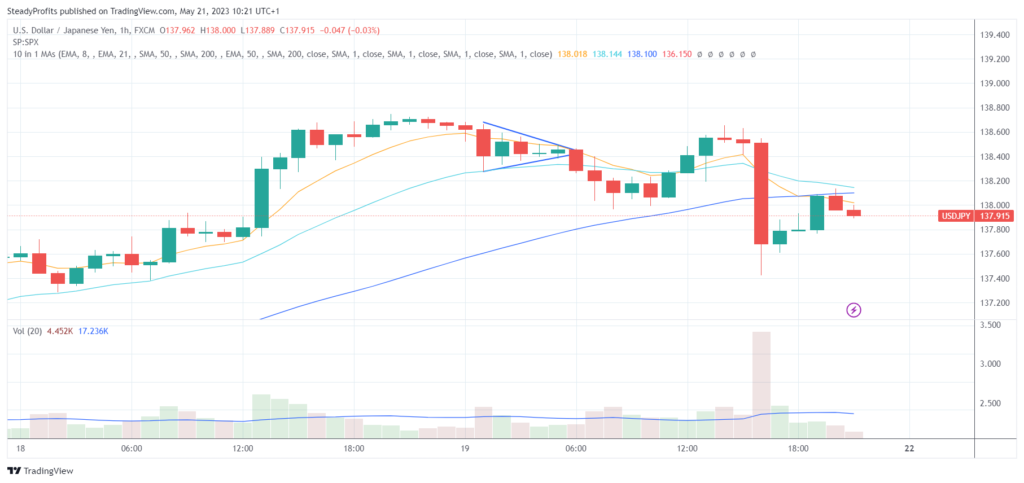
There was a large red candle at 1.00 AM UK time right at the start of the Asian trading session on the USD/JPY pair, followed by four very small candles that all traded within the range of this initial candle between 2 AM and 6 AM, as you can see below:
Trading Opportunity
With a narrow triangle forming on this inside bar set-up, it was only a matter of time before the price broke upwards or downwards out of this tight range, and when it did occur the hourly breakout candle closed at 7 AM, just when volume starts to pick up before the London market opens.
Therefore it was always likely to continue moving, and in this case if you had taken a short position at the close of the breakout candle at 138.28, you could have ridden it down to the 138.00 whole number or closed a partial for 28 pips profit, where it ended up finding support.
You could also have zoomed into the 1 or 5-minute chart to get an earlier entry point during the 1-hour breakout candle once it looked likely that this breakout was likely to continue.
Final Thoughts
Of course it’s easy to talk about these profitable set-ups after they have occurred, but the point is that these inside bar formations occur all the time, and when you a get a long extended set-up of 5 hourly candles in this case, the odds of success are extremely high when the breakout does eventually happen.
Therefore you always want to be scanning the charts of various pairs (on various time frames) to try to visually spot them when they are setting up because they can be very profitable to trade.
