At this time of the year, the summer holidays are well and truly over and we start to see decent volumes in the forex markets, and large price moves in many of the major currency pairs.
So it’s interesting to take a look at the GBP/USD pair because this is at a critical point right now.
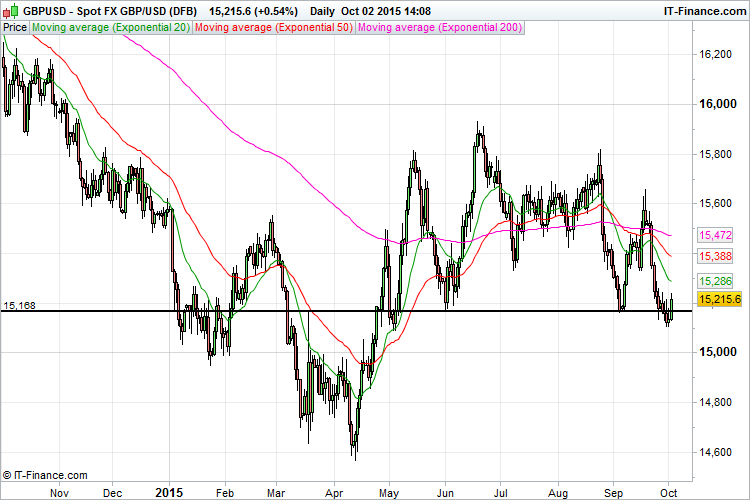
If you take a look at the chart below, you will see that this pair has just managed to fall below the horizontal trendline (indicated by the black line), which will often signal the start of a breakout, but has had a mini-rebound since then (and is in fact moving higher and higher as I write this article):

So it is still unclear whether this is a decisive break, in which case we could see this pair fall to around 1.46 – 1.48, or whether it is going to bounce off this level once again and head back into the trading range that has been established over the last 4 or 5 months.
From a trading perspective, this is definitely not a good trading opportunity at the moment because it really is a 50/50 shot, but if we could get a few more days of consolidation where the price hovers around the trendline, followed by a large down day, this would present more of an opportunity.
That’s because you will often see the price move out of a trading range and break through a trendline before retracing slightly. It’s often the second price move that confirms the breakout.
So we will have to wait and see what happens next.
