Price Falls in October
The price of crude oil has fallen quite sharply in recent weeks after posting new highs at the start of October.
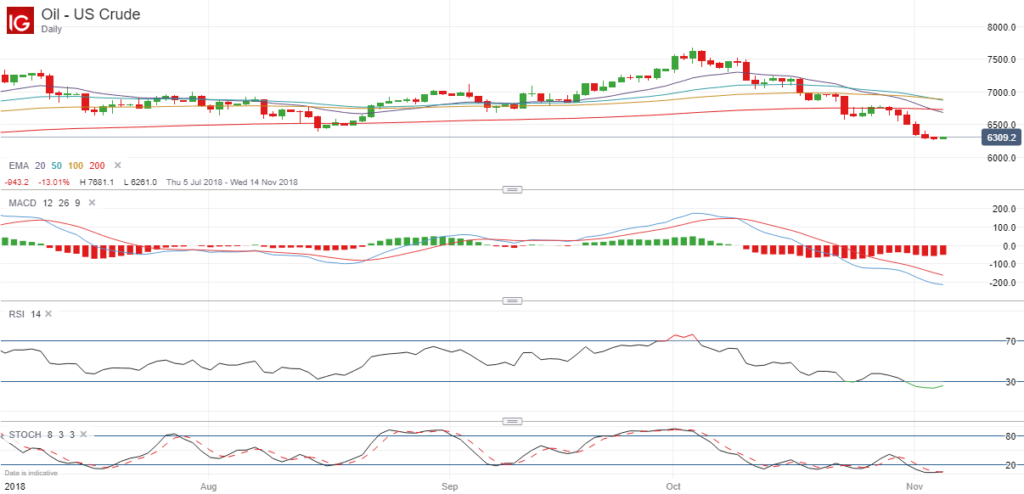
After posting a high of $86.65, the price of Brent crude is now trading at $72.83 per barrel at the time of writing, while the price of US crude oil has fallen from a high of $76.81 to $63.10.
Subsequently the price has actually broken below the all-important 200-day exponential moving average, which isn’t necessarily a sign of further weakness by itself because we haven’t yet a death cross, where the EMA (50) crosses below the EMA (200). However it does show just how much the price has fallen from its highs.
The question is, how much lower can the price of oil go, and have we reached the bottom?
Future Price Prediction
I personally think that we are now very close to the bottom because some of my favorite technical indicators are suggesting that the downward price trend is running out of momentum.
For example, this is the chart that I am currently looking at for US Crude:

It might be a little hard to see on your computer screen or phone, but the MACD histogram bars are showing signs of divergence (failing to post new lows as the price hits new lows), and two of the most effective oversold and oversold indicators, ie the RSI and stochastics indicators, are both below the oversold levels of 30 and 20 respectively and look as if they are starting to turn upwards.
As a result of this, I would expect the price to move back to the 200-day moving averages on both Brent and US crude, which would give price targets of $74.71 and $67.28 respectively.
However these are just my own thoughts and opinions, and I am not recommending any trades or offering professional advice in any way.
I am not planning to go long on either market, but the fact that both of these commodities are starting to look oversold has made me look again at companies such as BP and Shell, whose prices have fallen along with the price of oil, particularly with both companies going ex-dividend this month.