Bitcoin’s Volatile Past
If you have ever purchased any Bitcoins, you will know that this particular cryptocurrency has been on a crazy ride so far.
Just 3 years ago today you could buy a single Bitcoin for just $222, which seemed really expensive at the time, but today it is worth a staggering $7620.
That’s only half the story as well because at one point Bitcoin experienced a surge in popularity as a result of widespread media exposure, and everyone seemed to be buying Bitcoin and jumping on the bandwagon.
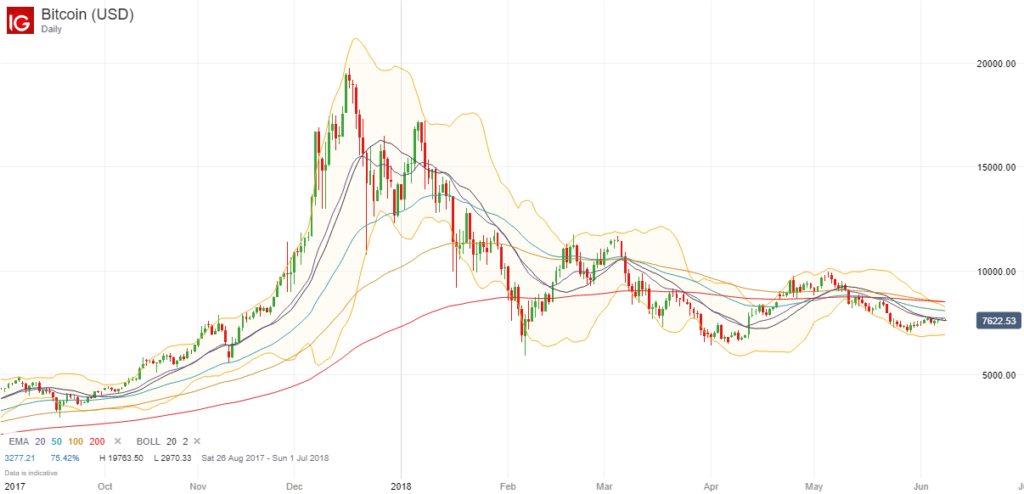
This helped to push the price of Bitcoin to an all-time high of $19,783.06 as demand far outstripped supply, but it has since fallen by more than 60% from its highs.
So while many people will have made some huge life-changing gains, a lot of people who were late to the party are nursing some massive losses.
Lack of Volatility in Summer 2018
In the last month or so, the price of Bitcoin appears to have stabilized between 7000 and 8000, and is a lot less volatile than it used to be. The days of massive price swings appear to be over, at least for now.
This can be seen in the price chart below because you can see that the Bollinger Band indicator, which itself is a good indicator of volatility, is as narrow now as it has ever been, and all of the EMAs (exponential moving averages) that I like to use are all very close together, which also indicates a low volatility sideways trading range.

Breakout Trading Opportunity?
It is extremely difficult to make money when an instrument is trading in a sideways trading range with no clear direction or momentum, but this is often the calm before the storm.
As soon as the price breaks out of one of these trading ranges with volume and momentum, it is often the start of a large breakout, either to the upside or downside, and therefore there is potentially a lot of money to be made by entering a position in the same direction as this breakout.
Of course there are no guarantees because you do sometimes see some false breakouts, but it will be interesting to watch the price of Bitcoin in the coming weeks.
If the price manages to move strongly upwards or downwards and smash through one of the outer Bollinger Bands, it could signal the start of a new trend, and therefore could represent a decent trading opportunity.
(Please note that this is just my own personal thoughts and ideas, and does not represent professional financial or trading advice in any way. You should always do your own research before trading Bitcoin or any other financial instrument.)
 You now have even more of an incentive to open a demo account with ZuluTrade because they will shortly be running a demo trading contest where you can put your trading skills to the test and compete against other people to see who can generate the most profit.